The Ontologist and Mathematician should be able to find common ground because Cantor introduced set theory into the foundation of mathematics, and W3C OWL uses set theory as a foundation for ontology language. Let’s listen in as they mash up Cantor and OWL …
Ontologist: What would you like to talk about?
Mathematician: Anything.
Ontologist: Pick a thing. Any. Thing. You. Like.
Mathematician: [looks across the street]
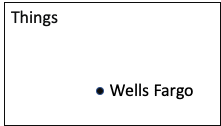
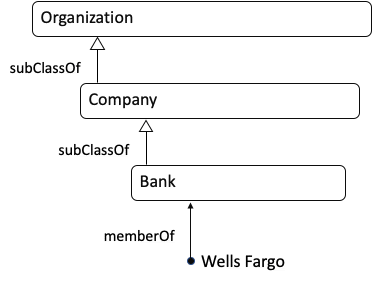
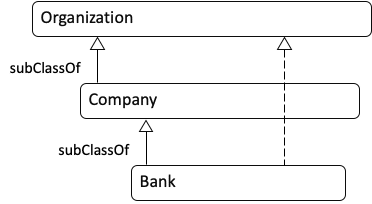
Ontologist: Sure, why not? Wells Fargo it is. If we wanted to create an ontology for banking, we might need to have a concept of a company being a bank to differentiate it from other types of companies. We would also want to generalize a bit and include the concept of Organization.
Mathematician: That’s simple in the world of sets.
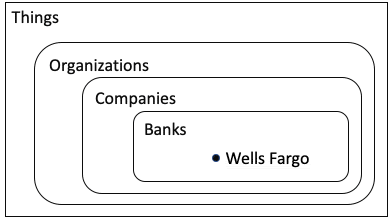
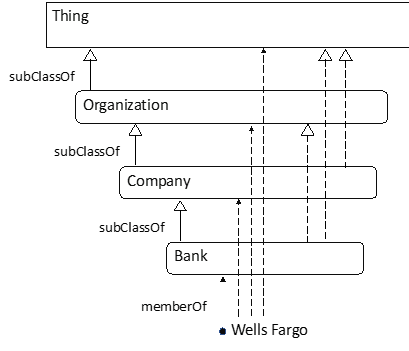
Ontologist: In my world, every item in your diagram is related to every other item. For example, Wells Fargo is not only a Bank, but it is also an Organization. Relationships to “Thing” are applied automatically by my ontology editor. When we build our ontology, we would first enter the relationships in the diagram below (read it from the bottom to the top):
Then we would run a reasoner to infer other relationships. The result would look like this:
Mathematician: My picture has “Banks” and yours has “Bank”. You took off the “s”.
Ontologist: Well, yes, I changed all the set names to make them singular because that’s the convention for Class names. Sorry. But now that you mention it … whenever I create a new Class I use a singular name just like everyone else does, but I also check to see if the plural is the good name for the set of things in the Class. If the plural doesn’t sound like a set, I rethink it. Try that with “Tom’s Stamp Collection” and see what you get.
Mathematician: I’d say you would have to rethink that Class name if you wanted the members of the Class to be stamps. Otherwise, people using your model might not understand your intent. Is a Class more like a set, or more like a template?
Ontologist: Definitely not a template, unlike object-oriented programming. More like a set where the membership can change over time.
Mathematician: OK. S or no S, I think we are mostly talking about the same thing. In fact, your picture showing the Classes separated out instead of nested reminds me of what Georg Cantor said: “A set is a Many that allows itself to be thought of as a One.”
Ontologist: Yes. You can think of a Class as a set of real world instances of a concept that is used to describe a subject like Banking. Typically, we can re-use more general Classes and only need to create a subclass to differentiate its members from the other members of the existing Class (like Bank is a special kind of Company). We create or re-use a Class when we want to give the Things in it meaning and context by relating them to other things.
Mathematician: Like this?

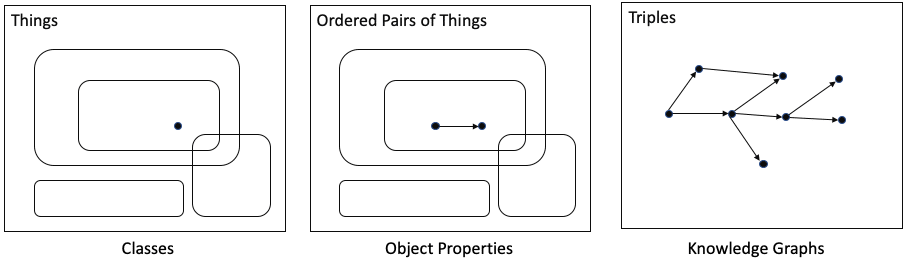
Ontologist: Exactly. Now we know more about Joan, and we know more about Wells Fargo. We call that a triple.
Mathematician: A triple. How clever.
Ontologist: Actually, that’s the way we store all our data. The triples form a knowledge graph.
Mathematician: Oh, now that’s interesting … nice idea. Simple and elegant. I think I like it.
Ontologist: Good. Now back to your triple with Joan and Wells Fargo. How would you generalize it in the world of sets?
Mathematician: Simple. I call this next diagram a mapping, with Domain defined as the things I’m mapping from and Range defined as the things I’m mapping to.
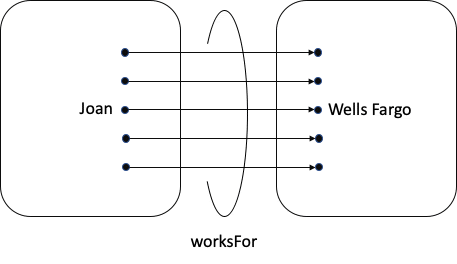
Ontologist: I call worksFor an Object Property. For today only, I’m going to shorten that to just “Property”. But. Wait, wait, wait. Domain and Range?

In my world, I need to be careful about what I include in the Domain and Range, because any time I use worksFor, my reasoner will conclude that the thing on the left is in the Domain and the thing on the right is in the Range.
Ontologist continues: Imagine if I set the Domain to Person and the Range to Company, and then assert that Sparkplug the horse worksFor Tom the farmer. The reasoner will tell me Sparkplug is a Person and Tom is a Company. That’s why Domain and Range always raise a big CAUTION sign for me. I always ask myself if there is anything else that might possibly be in the Domain or Range, ever, especially if the Property gets re-used by some else. I need to define the Domain and Range broadly enough for future uses so I won’t end up trying to find the Social Security number of a horse.
Mathematician: Bummer. Good luck with that.
Ontologist: Oh, thank you. Now back your “mapping”. I suppose you think of it as a set of arrows and you can have subsets of them.
Mathematician: Yes, pretty much. If I wanted to be more precise, I would say a mapping is a set of ordered pairs. I’m going to use an arrow to show what order the things are in; and voila, here is your set diagram for the concept:
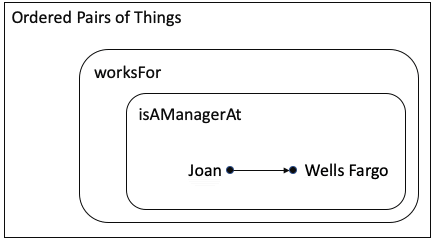
You will notice that there are two different relationships:
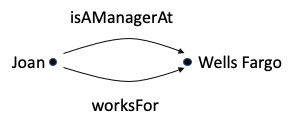
The pair (Joan, Wells Fargo) is in both sets, so it is in both mappings. Does that make sense to you?
Ontologist: Yes, I think it makes sense. In my world, if I cared about both of these types of relationships, I would make isAManagerAt a subProperty of worksFor, and enter the assertion that Joan is a manager at Wells Fargo. My reasoner would add the inferred relationship that Joan worksFor Wells Fargo.
Mathematician: Of course! I think I’ve got the basic idea now. Let me show you what else I can do with sets. I’ll even throw in some your terminology.
Ontologist: Oh, by all means. [O is silently thinking, “I bet this is all in OWL, but hey, the OWL specs don’t have pictures of sets.”]
Mathematician: [takes a deep breath so he can go on and on … ]
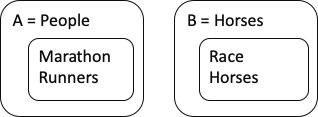
Let’s start with two sets:
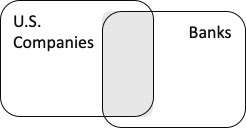
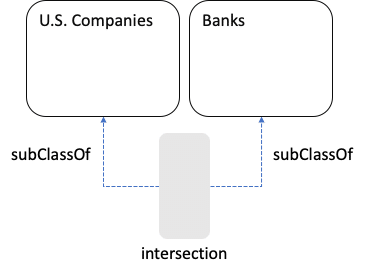
The intersection is a subset of each set, and each of the sets is a subset of the union. If we want to use the intersection as a Class, we should be able to infer:
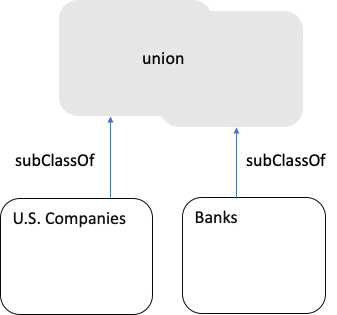
 And if we want to use the union as a Class, then each original Class is a Sub Class of the union:
If two Classes A and B have no members in common (disjoint), then every Sub Class of A is disjoint from every sub class of B:
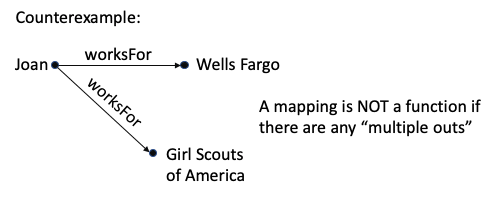
 A mapping where there is at most one arrow out from each starting point is called a function.
 A mapping where there is at most one arrow into each ending point is called inverse-functional.
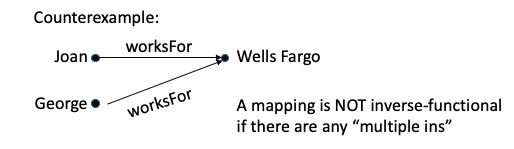
You get the inverse of a mapping by reversing the direction of all the arrows in it. As the name implies, if a mapping is inverse-functional, it means the inverse is a function.
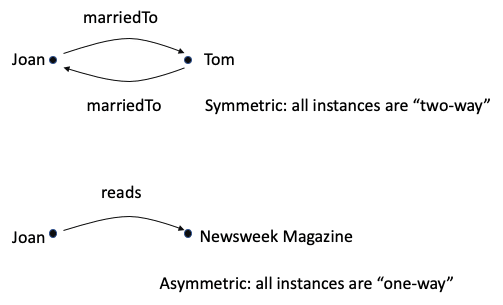
Sometimes the inverse mapping ends up looking just like the original (called symmetric), and sometimes it is “totally different” (disjoint or asymmetric).
 Sometimes a mapping is transitive, like our diagram of inferences with subClassOf, where a subclass of a subclass is a subclass. I don’t have a nice simple set diagram for that, but our Class diagram is an easy way to visualize it. Take two hops using the same relationship and you get another instance of the relationship:
Sets can be defined by combining other sets and mappings, such as the set of all people who work for some bank (any bank).
Ontologist: Not bad. Here’s what I would add:
Sometimes I define a set by a phrase like you mentioned (worksFor some Bank), and in OWL I can plug that phrase into any expression where a Class name would make sense. If I want to turn the set into a named Class, I can say the Class is equivalent to the phrase that defines it. Like this:
BankEmployee is equivalentTo (worksFor some Bank).
The reasoner can often use the phrase to infer things into the Class BankEmployee, or use membership in the Class to infer the conditions in the phrase are true. A lot of meaning can be added to data this way. Just as in a dictionary, we define things in terms of other things.
When two Classes are disjoint, it means they have very distinct and separate meanings. It’s a really good thing, especially at more general levels. When we record disjointness in the ontology, the reasoner can use it to detect errors.
Whenever I create a Property, I always check to see if it is a function. If so, I record the fact that it is a function in the ontology because it sharpens the meaning.
We never really talked about Data Properties. Maybe next time. They’re for simple attributes like “the building is 5 stories tall”.
A lot of times, a high level Property can be used instead of creating a new subProperty. Whenever I consider creating a new subProperty, I ask myself if my triples will be just as meaningful if I use the original Property. A lot of times, the answer is yes and I can keep my model simple by not creating a new Property.
An ontology is defined in terms of sets of things in the real world, but our data base usually does not have a complete set of records for everything defined in the ontology. So, we should not try to infer too much from the data that is present. That kind of logic is built in to reasoners.
On the flip side, the data can include multiple instances for the same thing, especially when we are linking multiple data sets together. We can use the sameAs Property to link records that refer to the same real-world thing, or even to link together independently-created graphs.
The OWL ontology language is explained well at: https://www.w3.org/TR/owl-primer/
However, even if we understand the theory, there are many choices to be made when creating an ontology. If you are creating an ontology for a business, a great book that covers the practical aspects is Demystifying OWL for the Enterprise by Michael Uschold.
Mathematician: I want the last word.
Ontologist: OK.
Mathematician:
 Ontologist: I agree, but that wasn’t a word. 🙂
Mathematician: OK. I think I’m starting to see what you are doing with ontologies. Here’s what it looks like to me: since it is based on set logic and triples, the OWL ontology language has a rock-solid foundation.
Written By: Phil Blackwood, Ph.D.


 mind, this drop will occur in the latter half of this year. To date, here have been very few cuts.
 In my
In my a Meaning-First data modeling approach. Why am I convinced Meaning-First will advance the data management discipline? Because Meaning-First is definitional, the path of both/and thinking, and it rests on a single structure, the triple, for virtually everything. The World-Wide Web Consortium (W3C) defined the standard
  identifies the logical designs that will allow the data to be connected and used. This requires primary and foreign key designs, logical data types and sizes, as well as join structures for assembling data from multiple tables. Third, create a physical model from the logical to model the storage strategy and incorporate vendor-specific implementation details.
 Semantic Meaning-First databases, known as triplestores, are not a collection of tables-with-columns. They are comprised of
  approach with machine-readable definitions to which new attribution can be added in production. At the same time this clarity is added to the data management toolkit, semantic technology sweeps away the nearly infinite collection of complex table-with-column structures with the one single, standards-based