
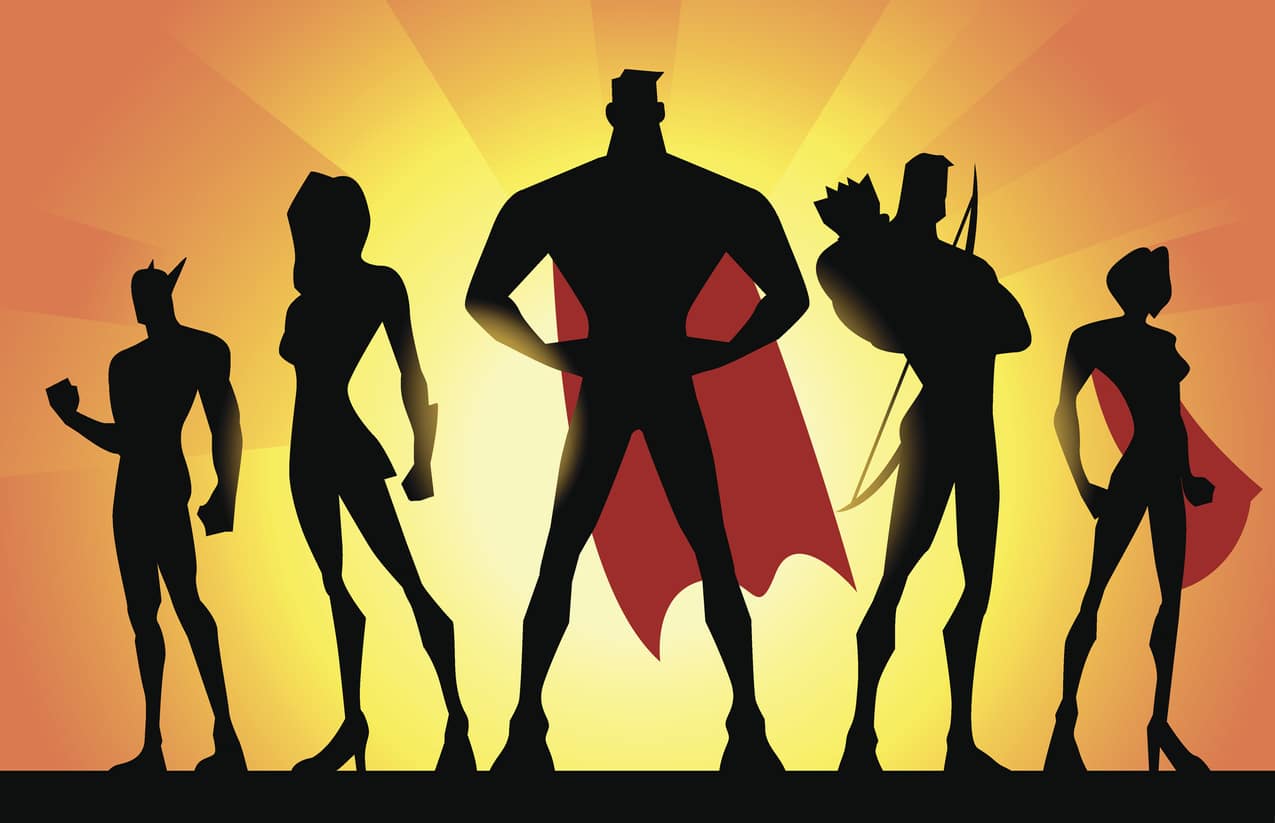
The graph database market is very exciting, as the long list of vendors continues to grow. You may not know that there are huge differences in the origin story of the dozens of graph databases on the market today. It’s this origin story that greatly impacts the superpowers and weaknesses of the various offerings.
While Superman is great at flying and stopping locomotives, you shouldn’t rely on him around strange glowing metal. Batman is great at catching small-time hoods and maniacal characters, but deep down, he has no superpowers other than a lot of funding for special vehicles and handy tool belts. Superman’s origin story is much different than Batman’s, and therefore the impact they have on the criminal world is very different.
This is also the case with graph databases. The origin story absolutely makes a difference when it comes to strengths and weaknesses. Let’s look at how the origin story of various graph databases can make all the difference in the world when it comes to use cases for the solutions.
Graph Database Superhero: RDF and SPARQL databases
Examples: Ontotext, AllegroGraph, Virtuoso and many others
Origin Story: Short for Resource Description Framework, RDF is a decades-old data model with origins with Tim Berners-Lee. The thought behind RDF was to provide a data model that allows the sharing of
data, similar to how we share information on the internet. Technically, this is the classic triple-store with subject-predicate-object.
Superpower: Semantic Modeling. Basic understanding of concepts and the relationships between those concepts. Enhanced context with the use of ontology. Sharing data and concepts on the web. These databases often support OWL and SHACL, which help with the process of describing what the data should look like and the sharing of data like we share web pages.
Kryptonite: The RDF original specification did not account for properties on predicates very well. So for example, if I wanted to specify WHEN Sue became a friend of Mary, or the fact that Sue is a friend of Mary, according to Facebook, handling provenance and time may be more cumbersome. Many RDF databases added quad-store options where users could handle provenance or time, and several are adding the new RDF* specification to overcome shortcomings. More on this in a minute.
Many of the early RDF stores were built on transactional architecture, so that they scaled somewhat to handle transactions, but had size restrictions on performing analytics on many triples.
It is in this category that the vendors have had some time to mature. While the origins may be in semantic web and sharing data, many have stretched their superpowers with labeled properties and other useful features.
Graph Database Superhero: Labeled Property graph with Cypher
Example: Neo4j
Origin Story: Short for labeled property graph, the premier player in the LPG was and is Neo4j. According to podcasts and interviews of the founder, the original thought was more about managing content on a web site, where taxonomies gave birth to many-to-many relationships. Neo4j developed its new type of system in order to support its enterprise content management team. So, when you needed to search across your website for certain content, for example, when a company changes its logo, the LPG kept track of how these assets were connected. This is offered as an alternative to the JOIN table in an RDBMS that holds foreign keys of both the participating tables, and this is extremely costly in traditional databases.
SuperPower: Although the origin story is about web site content taxonomies, it turns out that these types of databases were also pretty good for 360-degree customer view applications and understanding multiple supply chain systems. Cypher, although not a W3C or ISO standard, has become a de facto standard language as the Cypher community has grown with Neo4j’s efforts. Neo4j also has been an advocate of the new upcoming GQL standard, which may result in a more capable Cypher language.
Kryptonite: Neo4j has built its own system from the ground up on a transactional architecture. Although some scaling features have recently been added to Neo4j version 4, the approach is more about federating queries rather than an MPP approach. In version 4, the developers have added manual sharding and a new way to query sharded clusters. This requires extra work when sharding and writing your queries. This is a similar approach to transactional RDF stores where SPARQL 1.1, supports integrated federated queries through a SERVICE clause. In other words, you may still encounter limits when trying to scale and perform analytics. Time will tell if the latest federated approach is scalable.
Ontologies and inferencing are not standard features with a property graph, although some capability is offered here with add-ons. If you’re expecting to manage semantics in a property graph, it’s probably the wrong choice.
Graph Database Superhero: Proprietary Graph
Example: TigerGraph
Origin Story: According to their web site, when the founders of TigerGraph decided to write a database, one of the founders was working at Twitter on a project that needed bigger scale graph algorithms than Neo4j could offer. TigerGraph devised a completely new architecture for the data model and storage, even devising its own language for a graph.
Superpowers: Through Tiger, the market could now appreciate that graph databases could now run on a cluster. Although certainly not the first to run on a cluster, this focus was on real power in running end-user supplied graph algorithms on a lot of data.
Kryptonite: The database decidedly went on its own with regard to standards. Some shortcomings on the simplicity of leveraging ontologies, performing inferencing and make use of your people who know either SPARQL or Cypher are apparent. By far the biggest disadvantage to this proprietary graph is that you have to think more about schema and JOINs prior to loading data. The schema model is more reminiscent of a traditional database than any of the other solutions on the market. While it may be a solid solution for running graph algorithms, if you’re creating a knowledge graph by integrating multiple sources and you want to run BI-style analytics on said knowledge graph, you may have an easier time with a different solution.
Interesting to note that although TigerGraph’s initial thinking was to beat Neo4j at proprietary graph algorithms, TigerGraph has teamed up with the Neo4j folks and is in the early stages of making its proprietary language a standard via ISO and SQL. Although TigerGraph releases many benchmarks, I have yet to see them release benchmarks for TPC-H or TPC-DS, standard BI-style analytics benchmarks. Also, due to a non-standard data model, harmonizing data from multiple sources requires some extra legwork and thought about how the engine will execute analytics.
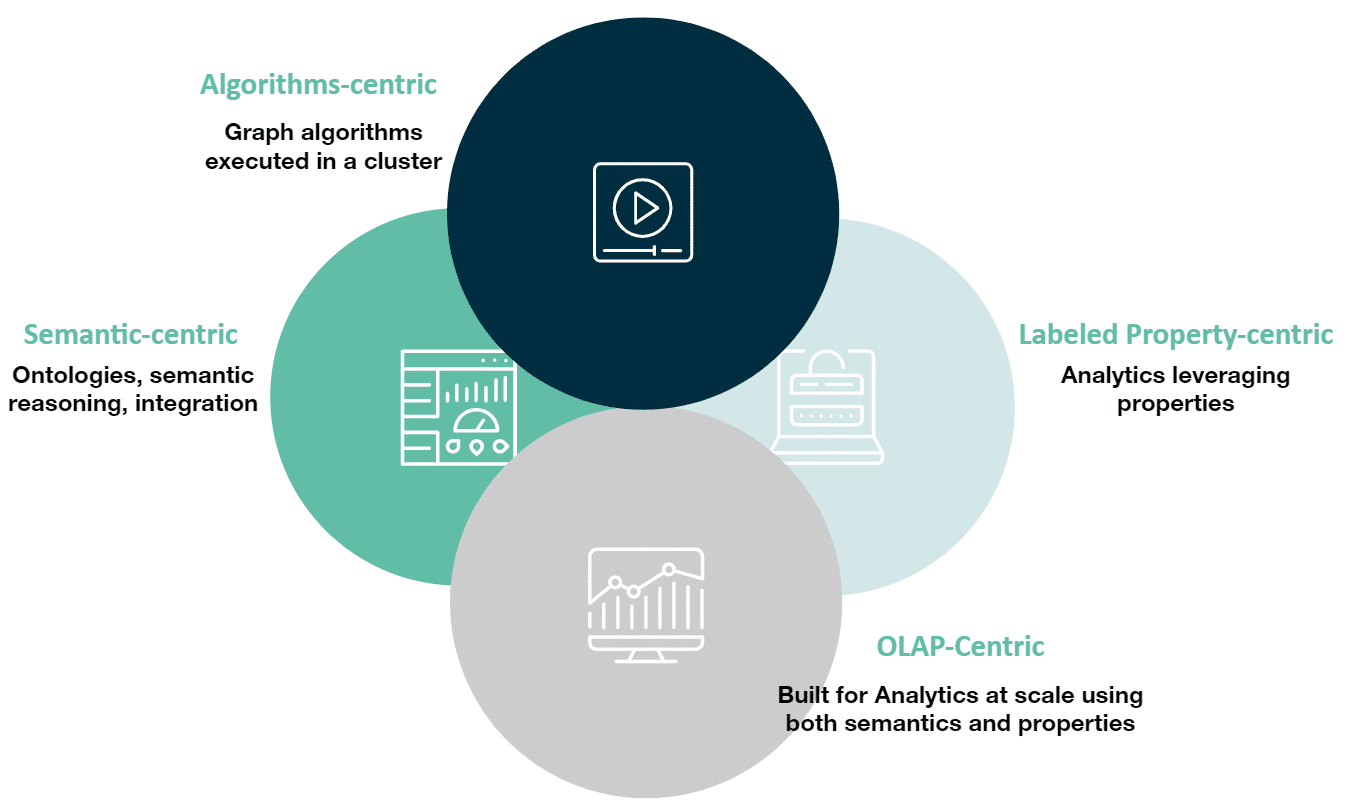
Graph Database Superhero: RDF Analytical DB with labeled properties
Example: AnzoGraph DB
Origin Story: AnzoGraph DB was the brainchild of former Netezza/Paraccel engineers who designed MPP platforms like Netezza, ParAccel and Redshift. They became interested in graph databases, recognizing that there was a gap in perhaps the biggest category of data, namely data warehouse-style data and analytics. Although companies making transactional graph databases covered a lot of ground in the market, there were very few analytical graph databases that could follow standards, perform graph analytics and leverage ontologies/inferencing for improved analytics.
Superpowers: Cambridge Semantics designed a triple store that both followed standards and could scale like a data warehouse. In fact, it was the first OLAP MPP platform for graph, capable of analytics on a lot of triples. It turns out that this is the perfect platform for creating a knowledge graph, facilitating analytics built from a collection of structured and unstructured data. The data model helps users load almost any data at any time.
Because of the schemaless nature, the data can be sparsely populated. It supports very fast in-memory transformations, thus data can be loaded and cleansed later (ELT). Because metadata and Instance data together in the same graph and without any special effort — sure makes all those ELT queries much more flexible, iterative and powerful. With an OLAP graph like AnzoGraph DB, you add any subject-predicate-object-property at any time without having to make a plan to do so.
In traditional OLAP databases, you can have views. In this new type of database, you can have multi-graphs that can be queried as one graph when needed.
Kryptonite: Although ACID compliant, other solutions on the market might support faster transactions due to the OLAP nature of this database’s design. Ingestion of massive amounts of transactions might require additional technologies, like Apache Kafka, to ingest smoothly in high-transactional environments. Like many warehouse-style technologies, data loading is very fast and therefore batch loads are very fast. Pairing an analytical database with a transactional database is also sometimes a solution for companies who have both high transactions and deep analytics to perform.
Other types of “Graph Databases”
A few other types of graph databases that have some graph superpowers. Traditional database vendors have recognized that graph can be powerful and have offered a data model to have a graph model in addition to their native model. For example, Oracle has two offerings. You can buy an add-on package that offers geospatial and graph. In addition, the company offers an in-memory graph that is separate from traditional Oracle.
You can get graph database capabilities in an Apache Hadoop stack under GraphFrames. GraphFrames works on top of Apache Spark. Given Spark’s capability to handle big data, scaling is a superpower. However, given that your requirements might lead you to layering technologies, tuning a combination of Spark, HDFS, Yarn and GraphFrames could be the challenge.
The other solutions give you a nice taste of graph functionality in a solution that you probably already have. The kryptonite here is usually about performance when scaling to billions or trillions of triples and then trying to run analytics on said triples.
The Industry is full of Ironmen
Ironman Tony Stark built his first suit out of scrap parts when he was captured by terrorists and forced to live in a cave. It had many vulnerabilities, but it served it’s one purpose: to get the hero to safety. Later, the Ironman suit evolved to be more powerful, deploy more easily and think on its own. The industry is full of Tony Starks who will evolve the graph database.
However, while evolution happens, remember that graph databases aren’t one thing.
A graph database is a generic term, but simply doesn’t get you the level of detail you need to understand which problem it solves. The industry has developed various methods of doing the critical tasks that drive value in this category we call graph databases. Whether it’s harmonizing diverse data sets, performing graph analytics, performing inferencing and leveraging ontologies, you really have to think about what you’d like to get out of the graph before you choose a solution.