
How Semantic Arts helped a global contract research organization bring its own trial history, public registries, and commercial data into one knowledge graph of sites, institutions, and investigators.
| Client | Global full-service contract research organization (CRO), 3,000+ employees in 50+ countries |
| Domain | Clinical-trial operations: identifying and selecting trial sites |
| What we did | Enterprise ontology design and knowledge graph build |
| Sources | The CRO’s own study history, ClinicalTrials.gov, and a commercial trial database |
| Standards | RDF, OWL, SHACL, SPARQL; gist and gistPharma; MONDO disease ontology |
| When | 2025, with data refreshes in 2026 |
| Status | Completed; follow-on work on digital trial protocols |
The challenge
When a drug sponsor puts a clinical trial out to bid, a contract research organization (CRO) must estimate what it will cost to activate potential trial sites, to attract and screen potential patients, and then enroll a subset. The choice is a gamble. Industry research finds that more than a third of trial sites enroll poorly and about one in ten never enrolls a single patient (Tufts CSDD, 2012). A site that enrolls no one still costs time and start-up money.
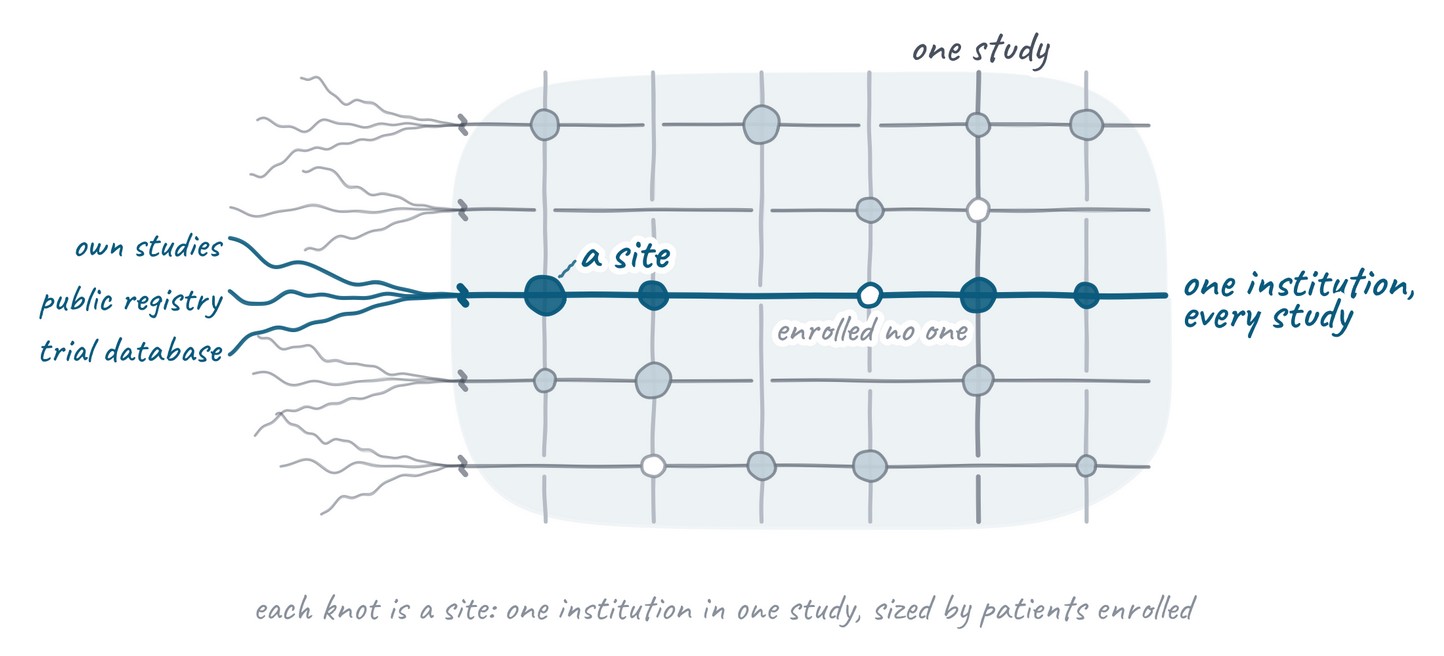
A global full-service CRO wanted to learn from experience: which sites, institutions, and investigators have recruited well, and for which conditions. The evidence existed but was scattered. Its own study history, the public ClinicalTrials.gov registry, and a commercial trial database each described the same hospitals, sites, and investigators their own way, with their own identifiers, across millions of records.
What Semantic Arts did
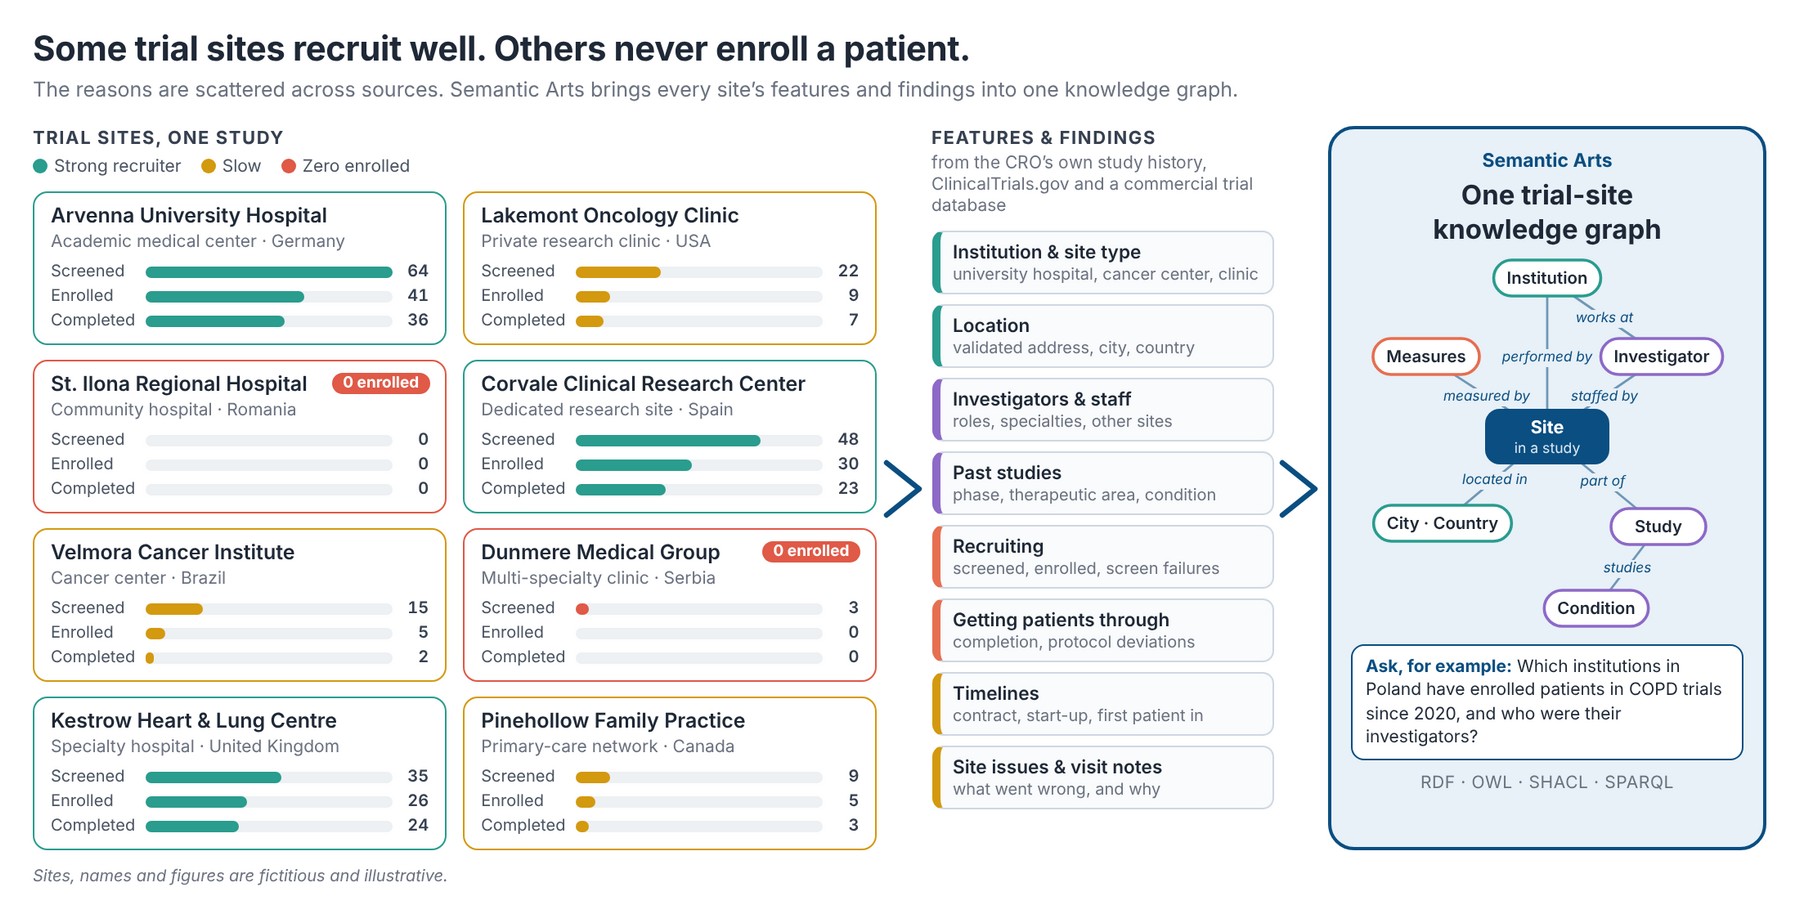
Semantic Arts thought big and started small. We modeled the CRO’s enterprise ontology from gistPharma, our life-sciences extension of the gist upper ontology, then populated it one dataset at a time. The pivotal decision was what a site is: in the model, a site is an institution’s contribution to one study, at one location, with its investigators and staff. The same institution can then be followed across every study it has taken part in, whichever source reported it, and recruiting measures such as patients screened and enrolled, screen failures, start-up timelines, and protocol deviations can be compared across studies and countries.
Records on institutions, study sites, investigators, studies, and therapeutic areas were converted and loaded, with SHACL shapes and quality checks at each step, into a knowledge graph of more than 20 million triples in the first phase, close to 150 million with the 2026 work. Identifiers were designed so the same entity from different sources aligns. Built-in vector search proposed links from the CRO’s disease terms to the MONDO disease ontology, with no separate vector database. Competency questions, the business questions the graph must answer, were defined with the CRO’s experts; in the first phase, the graph answered most of them using only SPARQL.
What it makes possible
The graph puts a site’s track record across the CRO’s own studies and everyone else’s in one place. It can find institutions with experience in a given condition and country, and those with none; follow an investigator across institutions and studies; and compare sites on recruiting speed, screen failures, start-up time, and protocol deviations. With conditions linked to a standard, studies can be grouped by disease whatever words the sources use.
What’s next
The graph became a foundation. Semantic Arts went on to design the ontology, patterns, and taxonomy that turn ubiquitous trial protocol documents into knowledge-graph data, organized by the ICH M11 structured-protocol template. As protocols flow in, the CRO can lean on the historical graph to choose sites. Semantic Arts is scoping how to add site issue reports and meeting notes.
Your next move
Bring Semantic Arts your most difficult ClinOps data challenge, whether it’s site selection, feasibility, or protocol complexity. We have likely solved something similar. We model your data semantically so you can store it, find it, use it in its entirety, scale it, and own it completely. The data’s meaning is self-contained and available for your APIs or LLM interactivity.
All six case studies in one PDF (16 pages, 3.7 MB)
Contact Us
Overcome integration debt with proven semantic solutions. Contact Semantic Arts, the experts in data-centric transformation, today.
Address: Semantic Arts, Inc.
123 N College Avenue Suite 218
Fort Collins, CO 80524
Email: [email protected]
Phone: (970) 490-2224