As a Semantic Arts ontologist, you will be essential in fixing the tangled mess of information in client enterprise systems and promoting a world where enterprise information is widely understood and easily accessed by all who have permission. Come work with the best in the business on interesting projects with global leaders!
Working together with other ontology consultants, you will take existing design artifacts and work with subject matter experts to convert models to formal semantic expressions for clients. We work with a diverse set of clients of all sizes and across industries. Therefore, you can expect a variety of work across many domains of knowledge. We have a strong sense of team, with no rigid hierarchy and place a high value on individual input.
Requirements:
A passion for information and knowledge modeling
Must be trained in ontological development, either through formal training or on-the-job development.
Should have experience in data modeling or related analytical skills.
Strong interpersonal communication skills, experience managing client, stakeholder, and internal interactions.
Experience in OWL, RDF, SPARQL and the ability to program against triplestores
A desire to learn new domains of knowledge in a fast-paced environment.
Bachelor’s degree in Computer Science, Information Systems, Knowledge Management, Engineering, Philosophy, Business, or similar.
Nice to Have:
Prior use or understanding of W3C semantic web standards
Advanced academic degree preferred.
About Us:
Promoting a vision of Data-Centric Architecture for more than 20 years, people are catching on! We have been awarded the 2022 ″Colorado Companies to Watch”, 2022 “Top 30 Innovators of the Year”, 2021 “30 Innovators to Watch”, and 2020 “30 Best Small Companies to Watch”. Semantic Arts is growing quickly and expanding our domains, projects, and roles. We have assembled what might be the largest team of individuals passionately dedicated to this task, making Semantic Arts a great place to develop skills and grow professionally in this exciting field.
What We Offer:
Remote Position, with travel for onsite work with clients required (up to 3 days every 3 weeks)
Professional development fund to develop skills, attend conferences, and advance your career.
Medical, Dental, and Vision Benefits
SIMPLE IRA with company match
Student Loan Reimbursement
Annual Bonus Potential
Equipment Purchase Assistance
Employee Assistance Program
Employment Type:
Full-time
Authorization:
Candidates must be authorized to work for any employer within the US, UK, or Canada. We are not currently able to sponsor visas or hire outside of those countries.
Compensation:
Compensation for this position varies based on experience, billable utilization, and other factors. Entry-level ontologists start around $70,000 USD annually and generally rise quickly, with the overall average being approximately $150,000 USD, and about 1/3 of consultants averaging more than $175,000 USD. More details shared during the interview process.
Semantic Arts is committed to the full inclusion of all qualified individuals. In keeping with our commitment, we will take steps to assure that people with disabilities are provided reasonable accommodations. Accordingly, if a reasonable accommodation is required to fully participate in the job application or interview process, to perform the essential duties of the position, and/or to receive all other benefits and privileges of employment, please contact our HR representative at [email protected].
Semantic Arts is an Equal Opportunity Employer. We respect and seek to empower each individual and support the diverse cultures, perspectives, skills, and experiences within our workforce. We support an inclusive workplace where employees excel based on merit, qualifications, experience, ability, and job performance.
In order to ensure that clients can get what they expect when they buy software or services that purport to be “data-centric” we are going to implement a credentialling program. The program will be available at three levels.
Implementation Awards
These are assessments and awards given to clients for projects or enterprises to recognize the milestones on their journey to becoming completely data-centric.
It is a long journey. There is great benefit along the way, and these awards are meant to recognize progress on the journey
Software Certification
The second area is in certify that software meets the goals of the data-centric approach. There will be two major categories:
Middleware – databases, messaging systems, and non-application-specific tools that might be used in a data-centric implementation will be evaluated on its consistency with the approach
Applications – as described in the book “Real Time Financial Accounting, the Data Centric Way” we expect that vertical industries will be far easier and more consistent with the data-centric approach. Horizontal applications will be evaluated based on their ease of being truly integrated with the rest of a data-centric enterprise. Adhering to open models and avoiding proprietary structures will also improve the rating in this area.
Professional Services
There will be two levels of professional services credentialling, one based on what you know and the other on what you’ve done.
The “what you know “will be based on studying and testing akin to the Project Management Institute of the Data Management DMBOK.
The “what you’ve done” recognizes that a great deal of the ability to deliver these types of projects is based on field experience.
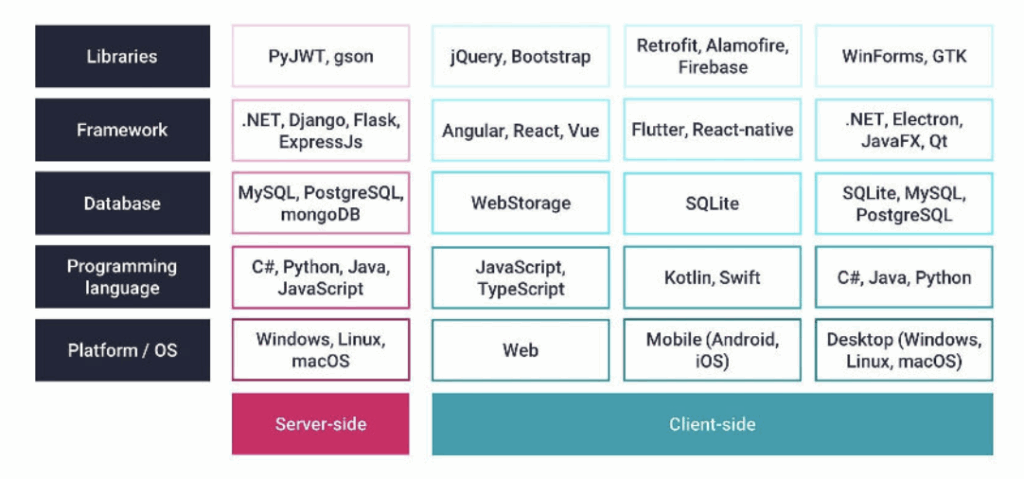
Virtually all technology projects these days start with a “tech stack.” The tech stack is a primarily a description of the languages, libraries and middleware that will be used to implement a project. Data-Centric projects too, have a stack, but the relative importance of some parts of the stack are different in data-centric than traditional applications.
This article started life as the appendix to the book “Real Time Financial Accounting, the Data-Centric Way” and as a result it may emphasize features of interest to accounting a bit more, than otherwise, but hopefully will still be helpful.
Typical Tech Stacks
Here is a classic example of a tech stack, or really this is more of a Chinese menu to select your tech stack from (I don’t think most architects would pick all of these)
A traditional Tech Stack
Most of defining a stack is choosing among these. The choices will influence the capabilities of the final product, and they will especially define what will be easy and what will be hard. There are also dependencies in the stack. It used to be that the hardware (platform / OS) was the first and most important choice to make and the others were options on top of that. For instance, if you picked the DEC VAX as your platform you had a limited number of databases and even a limited number of languages to choose from.
But these days many of the constraining choices have been abstracted away. When you select a cloud-based database, you might not even know what the operating system or database is. And the ubiquity of browser based front ends has abstracted away a lot of the differences there as well.
But that doesn’t mean there aren’t tradeoffs and constraints. One of the tradeoffs is longevity. If you pick a trendy stack, it may not have the same half-life as one that has been around a long while (although you might get lucky). And your choice of stack may influence the kind of developers you can attract.
Every decade or so there seem to be new camps that develop. For a while it was java stacks v C# and .Net stacks. Now a days two of the mainstream camps are react/ JavaScript v. python. Yes, there are many more but those two seem to get a lot of attention.
React/JavaScript seems to be the choice when UI development is the dominant activity and python when data wrangling, NLP and AI are top of mind.
Data-Centric Graph Stack
For those of us pursuing data-centric, the languages are important, but less so than with traditional development. A traditional development project with hundreds of interactive use cases is going to be concerned with tools that will help with the productivity and quality of the user experience.
In a mostly model-driven (we’ll get to that in a minute) data-centric environment, we’re trying to drastically reduce (close to zero) the amount of custom code that is written per each use case. In the extreme case, if there is no user interface code, it doesn’t really matter what language it wasn’t written it.
And on the other side if your data wrangling will involve hundreds of pipelines the ease at which each step is defined and combined will be a big factor. But when we focus on data at rest, rather than data flow, the tradeoffs change again.
Model Driven Development (short version)
In a traditional application user interface, the presentation and especially the behavior of the user interface is written in software code. If you have 100 user interfaces you will have 100 programs, typically each of them many thousand lines of code that access the data from a database, move it around in the DOM (the in memory data model of a web based app as an example) present it in the many fields in the user interface, manage the validation and constraint management and posting back to the database.
In a model driven environment rather than coding each user interface, you code one prototypical user interface and then adapt it parametrically. In a traditional environment you might have one form that has person, social security number and tax status and another form that has project name, sponsor, project management, start date and budget. Each would be a separate program. The model driven approach says we have one program, and you just send it a list of fields. The first example would get three fields and the second five. It’s obviously not that simple, and there are limits to what you can do this way, but we’ve found for many enterprise applications you can get good functionality for 90+% of your use cases this way.
If you only write one program, and the hundreds of use cases are “just parameters” (we’ll get back to them later) that’s why we say it doesn’t matter what language you don’t write your programs in.
One more quick thought on model driven (which by the way Gartner tends to call low code / no code) is there are two approaches. One approach is code generation. In that approach you write one program that writes the hundreds of application programs for you. This is likely what we’ll see from GenAI in the very near future, if not already. Some practitioners go into the generated code and tweak it to get exactly what they want. In that case it matters a great deal what language its written in.
But the other approach does not generate any code. The one bit of architectural code treats the definition of the form as if it were data and does what is appropriate.
Back to the Graph Stack
So, if we not overly focused on the programming languages what are we focused on, and why? In order for this discussion to make sense, we need to lay out a few concepts and distinctions, so that the priorities can make sense.
One of the big changes is the reliance on graph structures. We need to get on the same page about this before we proceed, which will require a bit of backtracking as to what the predominant alternatives are and how they differ.
Proto truths
We’re going to employ a pedagogical approach using “proto-truths.” Much of the technology we’re about to describe has deep and often arcane specifics. Technologists feel the need to drill down and explain all the variations of every new concept they introduce, which often gets in the way of the readers grasping the gestalt, such that they could, in due course appreciate the specifics.
The proto-truth approach says when we introduce a new concept, we’re going to describe it in a simplified way. This simplified way takes a subset of the concept, often the most exemplar subset, and describes the concept and how it fits with other concepts using the exemplars. Once we’ve conveyed how all the pieces fit together, we will cycle back and explain how the concepts work with less exemplar definitions. For technical readers we will mention that it is a proto-truth every time we introduce one, lest you say in your mind “no that isn’t the full definition of that concept.”
Structured Data
A graph is a different way of representing structured information. Two more common ways are tables and “documents.” Documents is in quotes here, as depending on your background you may read that and think Microsoft Word, or you may think json. Here we will mean the latter. But first let’s talk about tables as an organizing principle for structured data.
Tables
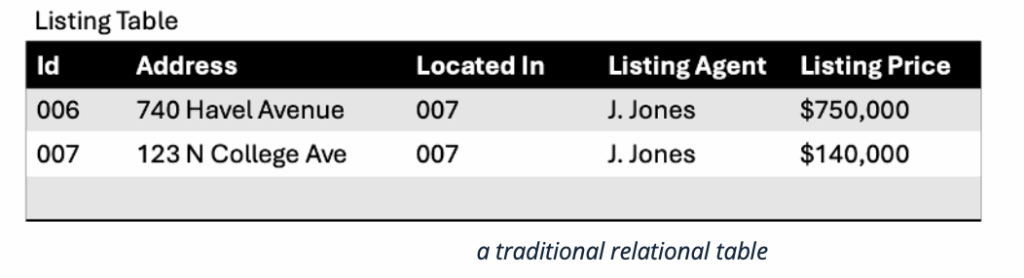
We use tables in relational databases as well as in spreadsheets, and we cut and paste them into financial reports.
In a table the data is in the cell. The meaning of the data is contextual. This context includes the row and column, but it also includes the database and the table. One allure of tables is their simplicity. But the downside is there is a lot of context for a human to know, especially when you consider that a large firm will have millions of tables. Most firms are currently trying to get a handle on their data explosion, including processes to document (sorry – different form of the word document) what all the databases, tables and columns mean. Collectively, these are the structured data’s “meta-data.” This is hard work, and most firms can only get a partial view, but even partial is quite helpful.
In “table-world” even if you know what all the databases, tables and columns mean, you are only part way home. As a famous writer once said:
“There is a lot more to being a good writer than knowing a lot of good words. You … have … to … put … them … in … the … right … order.”
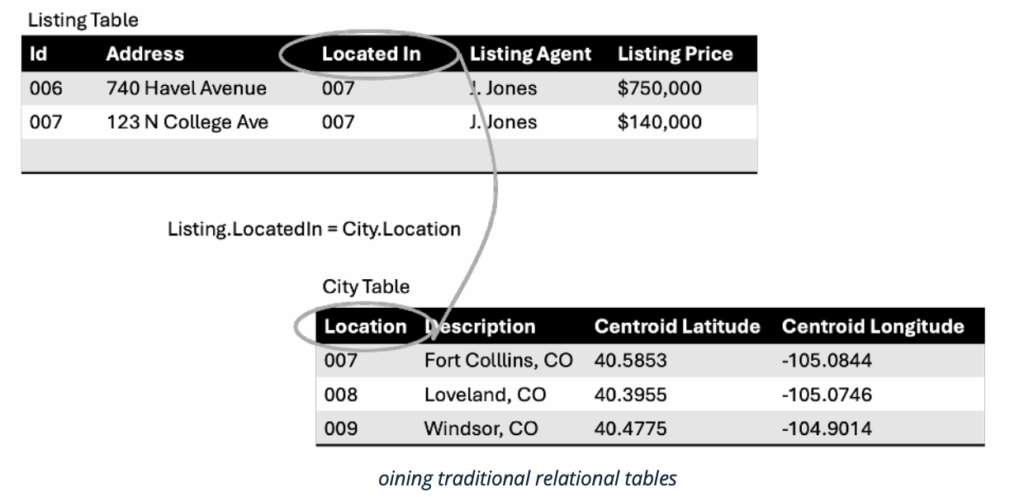
In an analogous way to writers putting words in the right order, people who deal with tabular data spend much of their time reassembling tables into something useful. It is rare that all the information you needed is in a single table. If it is, it is likely that one of your predecessors assembled it from other tables and so happened to do so in a way that benefits you.
This process of assembling tables from other tables is called “joining.” It sounds simple in classroom descriptions. You “merely” declare the column of one table that is to be joined (via matching) to another table.
But think about this for a few minutes. The person “joining” the tables needs to have considerable external knowledge about which columns would be good candidates to join to which others. Most combinations make no sense at all and will get little or no result. You could join the zip code on a table of addresses with the salaries of physicians, but the only matches you’d get would be a few underpaid physicians on the West coast.
This only scratches the surface of the problem with tables. This “joining” approach only works for tables in the same database. Most tables are not in the same database. Large firms have thousands of databases. To solve this problem, people “extract” tables from several databases and send them somewhere else where they can be joined. This partially explains the incredible explosion of numbers of tables that can be found in most enterprises.
The big problem with table based systems is how rapidly the number of tables can explode, and as it does the difficulty of know which table to access, what the columns mean and how to join them back together becomes a bit barrier to productivity. In a relational database the meaning of the columns (if defined at all) is not in the table. It might be in something the database vendor calls a “directory” but more likely its in another application, a “data dictionary” or a “data catalog.”
This was a bit of a torturous explanation of just a small aspect of how traditional databases work. We did this to motivate the explanation of the alternative. We know from decades of explaining; the new technology sounds complex. If you really understand how difficult the status quo is, you are ready to appreciate something better. And by the way we should all appreciate the many people who toil behind the scenes to keep the existing systems functioning. It is yeoman’s work and should be applauded. At the same time, we can entertain a future that requires far less of this yeoman’s work.
Documents
Documents, in this sense, as a store of structured information, are not the same as “unstructured documents.” Unstructured documents are narrative, written and read by humans. Microsoft Word, PDFs and emails are mostly unstructured. They may have a bit of structured information cut and pasted in, and they often have a bit of “meta-data” associated with them. This meta-data is different than the meta-data in tables. In tables the meta-data is primarily about the tables and columns and what they mean. For an unstructured document, meta-data is typically the author, maybe the format, the date created and last modified date, and often some tags supplied by the author to help others search later.
Documents in the Document Database sense though are a bit different. The exemplars here are XML and json (JavaScript Object Notation).
XML JSON
semi structured “documents”
The difference here between tables and documents is that with documents the equivalent of their meta-data (part of it anyway) is co-located with the data itself. The json version is a bit more compact and easier to read, so we’ll use json for the rest of this section.
The key (if you pardon the pun) to understanding json lies in understanding the key/value concept. The json equivalent to a column in a table is the key. The json equivalent to a cell in a table is a value. In the above, “city” is a key, and “Fort Collins” is a value. Everything surrounding the key/value pair is structure or context. For instance, you can group all the key/value pairs that would have made up a row in a table, inside a matching pair of “{ }”s. The nesting that you see so often in json (where you have “{… }” inside another “{ …}” or “[…]” ) is mostly the equivalent of a join.
An individual file, with a collection of json in it, is often called a dataset. A dataset is a mostly self-contained data structure that serves some specific purpose. These files / datasets look and act like documents. They are documents, just not the type for casual reading. When people put a lot of them in a database for easier querying, this is called a “document database.” They are handy and powerful, but unless you know what the keys and the structure mean, you don’t know what the data means. The number and complexity of these datasets can be overwhelming. Again, kudos to the many men and women who manage these and keep everything running, but again, we can do better.
Graph view of tables or documents
Many readers already familiar with graph technology will be raising their hands right now and saying things like “what about R2RML or json-LD?” Yes, there are ways to make tables and documents look like graphs, and consume like graphs, but this never occurs to the people using tables and documents. This occurs to the people using graph who want to consume this legacy data. And we will get to this, but first we need to deal with graphs and what makes them different (and better).
Graph as a Structuring Mechanism
In graph technology, the primitive (and only) way of representing information is in a “triple.” A triple has three parts: two nodes and an edge connecting them.
graph fundamentals
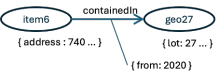
At the proto-truth level, the nodes represent individual real-world instances, sometimes called individuals. In this context individual is not a synonym for person, for instance in this example we have an individual house on an individual lot.
things not strings
These parenthetic comments are just for the reader, in a few moments we’ll fill in how we know the node on the left represents a particular house and the node on the right an individual lot that the house is on.
The line between the individuals indicates that there is some sort of relationship between the individuals.
naming the edges
In this case, the relationship indicates that the house is located at (on) the specific lot. The lot is not located at or on the house, and so we introduce the idea of directionality.
edges are directional
The node/edge/node is the basic graph structure and that the edge is “directed” that is, has an arrow on the end, makes this a “directed graph.”
There are two major types of graph databases in current use: labeled property graphs and RDF Databases, which are also known as Triple Stores. Labeled property graphs, such as the very popular Neo4j, are essentially document stores with graph features. The above triple might look more like this in a labeled property graph:
Attributes on the edges
Each node has a small document with all the known attributes for that node, in this case we’re showing the address, and the lot for the two nodes. The edge also has a small document hanging off it. This is what some people call “attributes on the edges” and can be a very handy feature. Astute readers will notice that we left the “:” off the front of the node and edge names in this picture. We will fill in that detail in a bit.
Triple stores do not yet have this feature (attributes on the edges) universally implemented, it is working its way through the standards committees, but there are still several reasons to consider RDF Triple stores. If you choose not to implement an RDF Triple store for your Data-Centric system, these Labeled Property Graphs are probably your next best bet. Both types of graph databases are going to be far easier than relational or document databases for solving the many issues that will need to be dealt with going forward.
Triple stores have these additional features which we think make them especially suitable for building out this type of system:
• They are W3C open standards compatible – there are a dozen viable commercial options and many good open-source options available. They are very compatible. Converting from one triple store to another or combining two in production is very straightforward.
• They support unambiguous identifiers – all nodes and all edges are defined by globally unique and potentially resolvable identifiers (more later) • They support the definition of unambiguous meaning (semantics) – also more later.
We have a few proto-truths that we have skipped over that we can fill in before we proceed. They have to do with “where did these things that look like identifiers come from and what do they signify?”
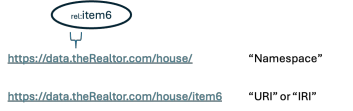
Figure 1 — the basic “triple”
The leading “:” is a presentation shorthand for a much longer identifier. In most cases there is a specific shorthand for this contextualizing information, which is called a “namespace.” The namespace represents a coherent vocabulary, and any triplestore can mix and match information from multiple vocabularies/ namespaces.
Figure 2 — introducing namespaces
In this example we show these items coming from three different namespaces or vocabularies. The one on the left: “rel:” might be short for a realtor group that identified the house. The “gist:” refers to an open-source ontology provided by Semantic Arts and the “geoN:” is short for geoNames – another open-source vocabulary of geospatial information. The examples without any qualifiers (the ones with only “:”) still have a namespace but it is whatever the local environment has declared to be the default.
Let’s inflate the identifier:
Prefixes are Shorthand for Namespaces
The “rel:”is just a local prefix that will get expanded anytime this data is to be stored or compared. The local environment fills in the full name of the namespace as shown here (a hypothetical example). The namespace is concatenated with what is called the “fragment” (the “item6” in this example) to get the real identifier, the “URI” or “IRI.”
IRIs are globally unique. So are “guids” (Globally Unique IDentifiers).
guids as globally unique ids
Being globally unique has some incredible advantages that we will get to in a minute, but before we do, we want to spend a minute to distinguish guids from IRIs. This guid (which I just generated a few minutes ago) may indeed be globally unique, but I have no idea where to go to find out what it represents.
The namespace portion of the IRI gives us a route to meaning and identity.
Using Domain Names in Namespaces to Achieve Global Uniqueness
Best practice (followed by 99% of all triple store implementations) is to base the namespace on a domain name that you own or have control over. As the owner of the domain name, and by extension the name space, you have the exclusive right to “mint” IRIs in this namespace. “Minting” is the process of making up new IRIs. With that right comes the responsibility to not reuse the same IRI for two different things. This is how global uniqueness is maintained in Triple Stores. It also provides the mechanism to find out what something means. If you want to know what https://data.theRealtor.com/house/item6 refers to you can at least ask the owners of theRealtor.com. In many cases the domain name owner will go one step further, and not only guarantee that the identifier is globally unique, but they will tell you what it means in a process call “resolution.” An IRI, following this convention, looks a lot like a URL. The minter of this IRI can, and often does, make the IRI resolvable. To the general public the resolution may just say that it is a house and here is its address. If you are logged in and authenticated it may tell you a lot more, such as who the listing agent is and what the current asking price is.
The URI/IRI provides an identifier that is both resolvable and globally unique. Resolvable means you have the potential of finding out what an identifier refers to. Let’s return to the value of global identifiers.
In the tabular, document and even labeled property graph, the identifiers are hyper-local. That is an identifier such as “007” only means what you think it means in a given database, table and column.
Figure 3 — Traditional systems require the query-er to reassemble tables into small graphs to get anything done
That same “007” could refer to a secret agent in the secret agent database, and a ham sandwich in the deli database. More importantly, if we want to know who has the Aston Martin this week we need to know, as humans, that we “join” the “id” column in the “agent table” with the “assigned to” column in the “car” table. This doesn’t scale and it’s completely unnecessary.
When you have global ids, you don’t need to refer to any meta data to assemble data. The system does it all for you. https://data.hmss.org.uk/agent/007 refers to James Bond no matter what table or column you find it in or if you find it on a web site or in a document.
Say we found or harvested these factoids and converted them to “triples”. This is depicted in the figure below. For readability, we’ve temporarily dropped the namespace prefixes and added in parenthetical comments.
Triples sourced independently
The first triple says the house is on a particular lot. The second triple says what city that lot is in. The third adds that it is also in a flood plain. The fourth, which we might have gotten from county records, says there is a utility easement on this lot. And the last is an inspection that was about this house (note the arrow pointing in the other direction).
The database takes all the IRIs that are identical and joins them. This is what people normally think of when they think of a graph.
Triples Auto-snapped Together
Notice that no metadata, was involved in assembling this data into a useful set and note that no human wrote any joins. Hopefully this hints at the potential. Any data we find from any source can be united, flexibly. If a different lot had 100 facts about it, that would be ok. We are not bound by some rigid structure.
Triples
But we still have a few more distinctions we’ve introduced without elaborating.
We introduced the “triple,” but didn’t elaborate. A triple is an assertion, like a small statement or sentence. It has the form: subject, predicate, object. In this case: :item6 (subject), :hasPhysicalLocation (predicate), :geo27 (object).
(subject) (predicate) (object)
Triples as Tiny Sentences
The one we showed backward should be read from the tail to the head of the arrow.
Read Triples in the Direction of the Arrow
The :insp44 (subject) :isAbout (predicate) :item6 (object).
A Schema Emerging
You may be willing to accept that behind the scenes we did something called “Entity Resolution.” This is very similar to what it is in traditional systems; it is the gathering up of clues about an entity (in this case the house, the lot, the city etc.) to determine whether the new fact is about the same entity we already have information about.
Assuming we have the software, and we are competent, we can figure out from clues (which we’ve skipped over so far) to determine that all facts about item6 are in fact about the same house. And that also behind the scenes we came up with some way to assign a unique fragment to the house (in this case the unusually short, but ok for the illustration “item6.”)
But you should wonder where did “:hasPhysicalLocation” come from. Truth is, we didn’t just make it up on the fly. This is the first part of the schema of this graph database. It must have existed before we could make this assertion using it.
We are going to draw this a bit differently, but trust us, everything is done in triples, it is just that some triples are a bit more primitive and special and well known than others. In this case we created a bit of terminology before we created that first triple. We declared that there was a “property” that we could reuse later. We did it something like this:
Schema are Triples too!
This is the beginning of an “ontology” which is a semantic data model of a domain. It is built with triples, exactly as everything else is, but it uses some primitive terms that came with the standards. In this case the RDF standard1 gives us the ability to declare a type for things, and in this case, we use the OWL standard 2to assert that this “property” is an object property. What that means is that it can be used to connect two nodes together, which is what we did in the prior example.
We’ve noticed that having everything be triples kind of messes with your mind when you first pick this up so we’re going to introduce a drawing convention, but keep in mind this is just a drawing convention to make it easier to understand, behind the scenes everything is triples, which is a very good thing as we’ll get to later.
There is something pretty cool going on here. The metadata, and therefore the meaning, of data is co-located with the data, using the same structural mechanics as the data itself. This is not what you find in traditional systems. In traditional systems the meta data is typically in a different syntax (DDL Data Definition Language is the metadata language for relational and DML Data Manipulation Language is its manipulation language), which is often in a different location (the directory as opposed to the data tables themselves) and is often augmented with more metadata, entirely elsewhere, initially in a data dictionary, and more recently in data catalogs, metadata management systems and enterprise glossary systems. With Graph Databases once you get used to the idea that the metadata is always right there, one triple away, you wonder how we lived so long without it.
In our drawing convention, this boxy arrow (which we call “defining a property”):
Shorthand for Defining a Property
Is shorthand for this declaration:
Defining a Property as Triples
Which makes it easier to see, when we want to use this property as a predicate in an assertion:
Defining a Property v. Using it as a Predicate in a Triple
This dotted line means that the predicate refers to the property, there isn’t really another triple there, in fact the two IRIs are the same. The one in the boxy arrow is defining what the property means. The one on the arrow is using that meaning to make a sensible assertion.
When we create a new property, we will add additional information to it (narrative to describe what it means, and additional semantic properties, but rather than clutter up the explanation, let’s just accept that there is more than just a label when you create a new property).
Classes
You may have noticed that we haven’t introduced any “classes” yet. This was intentional. Most design methodologies start with classes. But classes in traditional technology are very limiting. In relational “class” equals “table.” That is, the class tells you what attributes (columns) you can have, and in so doing limits you to what attributes you can have. If one row wants more attributes you must either grant them for all the rows in the table, or build a new table, for this new type of row.
In semantics the relationship between individuals and classes is quite different. A class is a set. We declare membership in a set by, (wait for it) a triple.
While this is all done with triples, once again they are pretty special triples, that are called out in the standards. In order for us to say that item6 is a House, we first had to create the class House.
Class Definition as Triples
Again, because we humans like to think of schema or metadata differently than instance data, we will draw classes differently — but keep in mind this is just a drawing convention and is a bit more economical on ink.
A shorthand for asserting an instance to be a member of a class
The incredible power comes when you free yourself from the idea that an instance (a row in a relational database) can only be in one class (table). When relational people want to say that something is a both a X (House) and a Y (Duplex) the copy the id into a different table, and export the complexity to the consumer of the data to know that they have to reassemble it..
Instances can be members of more than one class
In Object Oriented design, we might say that a Duplex is a sub type of a House. (all duplexes are houses not all houses are duplexes), but this is at the class level, which ends up being surprisingly limiting.
Now there might be a relationship between Duplex and House, but what if we also said
The classes themselves need not have any pre-existing relationship to each other
Maybe because you’re an insurance company or a fire department and you’re interested in which homes are made of brick. Note that many brick buildings are neither houses nor duplexes (they can be hospitals, warehouses or outhouses). In any event this is what we have
Venn diagram of instance to class membership
Our :item6 is in the set of Brick Buildings, Duplexes and Houses. Another item might be in any other combination of sets.
This is different from Object Oriented, which occasionally has “multiple inheritance,” where one class can have multiple parents. Here as you can see, one instance can belong to multiple unrelated classes.
This is where semantics comes in. We can define the set “Duplex,” and we would likely create a human readable definition for “Duplex.” But with Semantics (and OWL) we can create a formal, machine-readable definition. These machine-readable definitions allow the system to infer instances into a class, based on what we know about it. Let’s say that in our domain we decided that a Duplex was: a Building that was residential and had two public entrances. In the formal modeling language this looks like
Figure 4 — formal definition of a class
Which diagrammatically looks like this:
Defining a Class as the Intersection of Several Classes or Abstract Class Definitions
The two dashed circles represent sets that are defined by properties their individuals have. If an individual is categorized as being residential, it is in the upper dashed (unnamed) circle. If it has two public entrances, it is in the lower one. We are defining a duplex to be the intersection of all three sets, which we cross hatched here.
Don’t worry about understanding the syntax or how the modeling works, the important thing is this discipline is very useful in creating unambiguous definitions of things, and while it certainly doesn’t look like it here, this style of modeling contributes to much simpler overall conceptual models.
Inference
Semantic based systems have “inference engines” (also called “reasoners”) which can deduce new information from the information and definitions provided. We are doing two things with the above definition. One is if we know that something is a building and it is residential and has exactly two entrances, then we can infer that it is a Duplex.
Inferring a Triple is Functionally Equivalent to Declaring it
In this illustration we find :item6 has two public entrances and is a building and has been categorized as being residential. This is sufficient to infer it into the class of duplexes (the dotted line from :item6 to the Duplex class). Diagrammatically this is what causes it to be in the crosshatched part of the Venn diagram
On the other hand if all we know is that it is a Duplex, (that is if we assert that it is a member of the class :Duplex), then we can infer that it is residential and has two public entrances (and that it is a Building).
Triples can be Inferred to be true, even if we don’t know all their specifics
These additional inferred triples are shown dashed. This includes the case where we know that it has two public entrances even if we don’t know what or where they are.
Other Types of Instances
One of our proto-truths was that the individuals were real world things, like houses and lots and people. It turns out there are many other types of things that can be individuals and therefore can be members of classes and therefore can participate in assertions.
Any kind of electronic document that has an identity (a file name) can be an individual, so can any word document or a json file if it is saved to disk (and named). There are many real-world things that we represent as individuals even though they don’t have a physical embodiment. The obligation to pay your mortgage is real. It is not tangible. It may have been originally memorialized on a piece of paper but burning that paper doesn’t absolve you of the obligation.
Similarly, we identify “Events” — both those that will happen in the future (your upcoming vacation) and those that occurred in the past (the shipment of widgets last Tuesday). Categories (such as found in taxonomies) can also be individuals.
Other Types of Properties
We introduced a property that can connect two nodes (individuals). This is called an “Object Property.” There are two other types of properties:
• Datatype Properties
• Annotations
Datatype Properties allow you to attach a literal to a node. They provide an analog to the document that was attached to a node in the labeled property graph above.
Datatype Properties are for Attaching Literals to Instances
This is how we declare a datatype property in the ontology (model). Again, for diagraming we show it as a boxy arrow, and here we use it
Similar to Object Properties We Define Datatype Properties and then Assert them on Instances
Note the literal (“40.5853”) is not a node and therefore cannot be the subject (left hand side) of a triple. Literals are typically labels, descriptions, dates and amounts.
Annotation properties are properties that the inference engine ignores. They are handy for documentation to humans; they can be used in queries, and they can be used as parameters for other programs that are using the graph.
Triples Are Really Quads
Recall when we introduced the triple
(subject) (predicate) (object)
Recall the Classic Three-part Triple
Conceptually you can think of this being one line in a very narrow deep table:
Subject Predicate Object
:item6 :hasPhysicalLocation :geo27
:geo27 :hasEasment :oblig2
:insp44 :isAbout :item6
…
One Way of Thinking About Triples
Really triples have (at least) four parts. The fourth part is part of the spec, the other parts are implementation-specific.
Subject Predicate Object Named Graph
:item6 :hasPhysicalLocation :geo27 :tran1
:geo27 :hasEasment :oblig2 :tran1
:insp44 :isAbout :item6 File6
…
Really Triples Have Four Parts
Pictorially it is like this:
A Pictorial Way to Show the Named Graph
The named graph contains the whole statement, it is not directly connected to either node, or to the edge. Note from the table above many triples could be in the same named graph.
The named graph is a very powerful concept, and there are many uses for it. Unfortunately, you must pick one of the uses and use that consistently. We have found three of the most common uses for the named graph are:
• Partitioning, especially for speed and ease of querying – it is possible to put a tag in the named graph position that can greatly speed querying. • Security – some people tag triples to their security level, and use them in authorization
• Provenance – it is possible to identify exactly where each triple or group of triples came from, for instance from another system, a dataset or an online transaction.
Because of the importance of auditability in accounting systems we are going to use named graphs to manage provenance. We’ll dive in on how to do that when we get to the provenance section, but for now, there is a tag on every triple that can describe its source.
Querying Your Graph Database
Once you have your data expressed as triples and loaded in your graph database, you will want to query it. The query language, SPARQL, is the only part of the stack that isn’t expressed in triples. SPARQL is a syntactic language. We assume they did this in order to appeal to traditional database users who are used to SQL, which is the relational database query language. Despite the fact that SPARQL is simpler and
more powerful than SQL, it seems to have gathered few converts from the relational world. If they had known that making a syntactically similar language was not going to bring converts the standards group might have opted for a triples based query language (like WOQL) but they didn’t, so we’ll deal with SPARQL.
Syntactically, SPARQL looks a bit like SQL, or at least the SPARQL SELECT syntax looks like the SQL SELECT syntax. The big difference is the query writer does not need to “join” datasets, all the data is already joined. The query writer is traversing connections in the graph that are already connected.
SQL SPARQL
comparing SQL and SPARQL
At this simple level it isn’t obvious how much simpler a SPARQL query is. In practice SPARQL queries tend to be 3-20 times simpler than their SQL equivalents. Many have no SQL equivalent.
The SPARQL SELECT statement creates table-like structures, so when you need to export data from a graph database this is often the most convenient way to do so. SPARQL can also INSERT and DELETE data in a graph database, which is analogous to SQL, but SPARQL’s INSERTs and DELETEs must be shaped like triples.
The real power in SPARQL is its native ability to federate. You can easily write queries that interrogate multiple triple stores, even triple stores from different vendors. Because the triples are identical and there are very few and easy to avoid extensions to the query language it is feasible and often desirable to partition your data into multiple Graph Databases and assemble them at query time. This assembly is not the equivalent of “joins” you do not need to describe which strings to be matched to assemble a complete dataset, this assembly is just pointing at which databases you want to include in your scope.
Back to the Stack
That was a long segue. We now have all the requisite distinctions to begin to talk about the preferred stack.
Before we do, a quick disclaimer: we don’t sell any of the tech we describe in this stack (or any stack for that matter). We are trying to describe, from our experience, what the preferred components of the stack should be.
Center of the Stack
As we said earlier, once upon a time, stacks centered on hardware. Over time they centered on operating systems. We suggest the center of your universe should be a graph database conforming to the RDF spec (also usually called a “triple store”). Yes you can build your system on a proprietary database (and all the proprietary database vendors are silently muttering “no ours is better.”). Yes, yours is better. It might be easier, it might scale better, it might be easier for traditional developers to embrace. But those advantages pale, in our opinion, to the advantages we’re about to describe.
RDF Triple Stores are remarkably compatible. If you’ve ever ported a relational database application from one vendor to another (say IBM DB2 to Oracle or Oracle to Microsoft SQL Server) you know what I’m talking about. Depending on the size of the application that is a 6–18-month project. You will get T-Shirts at the end for your endurance.
The analogue in the triple store world is somewhere between a weekend and a few weeks. No T-Shirt for you. We’ve done this several times. Easy portability sounds nice, but you think: “I don’t port that often.” Yeah you don’t but that’s largely because it’s hard and this is the source of your vendors lock-in and therefore price pressure. Ease of porting brings the database closer to the commodity level, which is good for the economics.
But that’s not the only benefit. The huge advantage is the potential for easy heterogeneity. You might end up with several triple stores. They might be from the same vendor, but they might not. The fact that part of the SPARQL standard is how it federates, means that there is very little incremental effort to combine multiple databases (triple stores).
So, the first part of our stack is: RDF compliant Triple Stores.
The core of our recommended stack
The core of the core is the reliance on open standards based triple stores. The core of the UI are browsers. We’re sinking our pilings into two technologies that are not proprietary, have been stable for a long time, and we will not incur high switching costs as we move from vendor to vendor or open source product.
Before we move up a level in the stack we need to look at the role of models in a model driven environment in a triple store platform.
Configuration as Triples
In most software implementations, most configurations (the small datasets that turn on and off certain capabilities in the software) are expressed in json. This idea is super pervasive. It ends up meaning that configuration files are tantamount to code. They really say which code is going to be executed and which code will be ignored. This superpower of configuration files is what leads cyber security vendors to be hypervigilant about how the configuration files are set. A large percentage of the benchmarks from the Center for Internet Security deal with setting configuration files to insure the least compromised surface area for a given implementation.
But configuration files are out of band. We advocate most of the configuration that is possible in a given system be expressed in triples. The huge advantage is that the configuration triples are expressed using the same IRIs for the same concepts as the rest of the application. And the configuration can be interrogated by the query language (which a configuration file cannot)
Model Driven as Triples
Recall the earlier discussion about model driven development. Most model driven development also expresses their parameters in tables or some sort of json configuration file. But this requires a context shift to understand what’s going on. The parameters that define each use case can, and should be, triples. Many of the triples are referring to classes and properties in the triple store. If we use the same technology to store these parameters it becomes easy to query and find out for instance, which user interface refers to this class (because I’m contemplating changing it). This is a surprisingly hard thing to do in traditional technology. First you don’t know all the references in code to the concepts in the model. Second the queries are opaque text that aren’t offering up the secrets of their dependency.
Each new use case adds a few triples, that define the user interface, the fields on a form or the layout of a table or a card, and a few small snippets of sparql (for instance to populate a dropdown list).
The part of the stack where use cases are created
We also show a bespoke user interface. We’re finding that 2-5% of our user interfaces are bespoke. These green slivers are meant to suggest the incremental work to add a use case. Notice that the client architecture code doesn’t change and the server architecture code doesn’t change. (and of course the browser and triple store don’t change).
While sparql is in the stack, we should point out that the architecture does not allow sparql to be executed directly against the triplestore. This is a very hard security problem to control if you allow it. In this architecture, the sparql is stored in the triplestore along with all the other triples, at run time the client indicates the named sparql procedure to be executed and supplies the parameters.
Middleware
There are two middleware considerations: one much of what we described above can be purchased or obtained via open source. Depending on your needs, Metaphactory, Ontopic or AtomGraph may handle many of the requirements you have.
The second consideration is that you maybe want to add additional capability to your stack. Some of the more common are ingress and egress pipelines, constraint managers, entity resolution add ons, and unstructured text search.
Architecture showing some middleware add-ons
There you have a fairly complete data-centric graph stack.
The Data-Centric Graph Stack in Summary
This data-centric stack has some superficial resemblance to a more traditional development stack. While there are programming languages in both, in the traditional stack they are more important, as most of the application code will be built in code, and the choice is pretty key.
In the data-centric stack there is very little application code, and the language matters very little. The architecture is built is code, but again, it doesn’t matter much what language it is.
We think one we think some of the key distinctions of this architecture is in the red lines. There are very few, well controlled and well tested APIs that ensure there is only one pathway in for access to the database, and that all processes pass through the same gateways.
Amgen is a large biotechnology company committed to unlocking the potential of biology for patients suffering from serious illnesses by discovering, developing, manufacturing, and delivering innovative human therapeutics. Amgen, CEO Bob Bradway focuses on innovation to set the cultural direction. According to Bradway: “Push the boundaries of biotechnology and knowledge to be part of the process of changing the practice of medicine.”
Amgen’s goal is to provide life-changing value to patients with expediency. Democratized access to enterprise data speeds the process from drug discovery to drug delivery. One element Amgen’s strategic data leadership agreed upon is that a common language expedites product development by removing ambiguities that slow business processes.
Data capture comes from a multitude of information systems, each using their own data model and unique vocabularies. Different systems use different terminology to refer to the same concept. An organization steeped in data silos no longer works. The challenge is to provide a common intuitive model for all systems and people to use. Once such a model is in place, it is no longer laborious and expensive for enterprise consumers to benefit from the data. A decision to establish a semantic layer for building an enterprise data fabric emerged.
Amgen developed a vision of a Data-Centric Architecture (DCA) that transforms data from being system-specific to being universally available. Data is organized and unambiguously represented in data domains within a Semantic layer.
We recently recast large portions of the telecom Frameworkx Information Model into an Enterprise Ontology using patterns and reusable parts of the gist upper ontology. We found that extending gist with the information content of the Frameworx model yields a simple telecom model that is easy to manage, federate, and extend, as described below. Realizing accelerating time to market along with simplifying for cognitive consumption being typical barriers for success within the telecom industry, we’re certain this will help overcome a few hurdles to expediting adoption.
The telecommunications industry has made a substantial investment to define the Frameworx Information Model (TMF SID), an Enterprise-wide information model commonly implemented in a relational data base, as described in the GB922 User’s Guide.
Almost half of the GB922 User’s Guide is dedicated to discussing how to translate the Information Model to a Logical Model and then translate the Logical Model to a Physical Model. With gist and our semantic knowledge graph approach, these transformations were no longer required. The simple semantic model and the data itself are linked together and co-exist in a triple-store data base without requiring transformations.
The gist upper ontology is the result of many years of implementing knowledge graphs for Enterprises; using gist as our starting point gave us concepts with clear non-overlapping semantics and also provided a compact set of standard Object Properties (types of relationships) that was especially helpful. As an upper ontology, gist is well suited to be the starting point for creating an Enterprise knowledge graph.
Our telecom knowledge graph is based on the W3C Semantic Web standards, which are designed to operate at web scale and are a good fit for large networking and communications enterprises. In fact, many of the world’s largest companies are already using knowledge graphs.
We found that the inherent simplicity of the semantic approach is directly applicable to the Frameworx Information Model in the following ways:
we don’t need to maintain 3 types of models (conceptual, logical, and physical)
the data and the model are integrated, and they can be interpreted programmatically
the data in the knowledge graph is self-describing and discoverable
types of relationships are highly re-usable
Furthermore, the semantic approach has the major benefit of interoperability.
Some key aspects of the W3C Semantic Web standards that we applied include:
every Class and every Property in our knowledge graph has a globally unique identifier
the Web Ontology Language (OWL) was used to define the model and the data • constraints are defined using the SHACL constraint language
queries are written in the SPARQL query language
federation with existing relational data is done using the R2RML data mapping language
an open-source reasoner automatically makes inferences and helps detect errors
In OWL, the basic unit of capturing information is a triple of the form:
subject – predicate – object
This one simple structure for expressing all data is significantly simpler than the UML representation of the Frameworx Information Model. For example:
• the name of a predicate is typically just a verb, e.g. “conformsTo” • a given predicate may be used multiple times with the same subject • a Class can be thought of as a set, with subclasses as subsets
• a Class does not have pre-defined attributes or properties
Let’s explore how the patterns of the Frameworx Information Model became simpler as a result of using gist (refer to the GB922 User’s Guide for the UML representations of these patterns). The Frameworx Information Model includes the following patterns:
1. Atomic/Composite 2. Classification Groups 3. Entity/Entity Role 4. Entity/Entity Specification 5. Characteristic Specification/Characteristic Value 6. Resource/Service/Product
We will examine each of these …
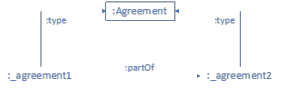
1- The Atomic/Composite pattern:
In this Frameworx pattern, an individual of a Class is composed of other individuals of the same Class. Below is an example of how we implemented this pattern:
In the diagram:
• :Agreement is a Class
• :_agreement1 and :_agreement2 are individual instances of Agreement • a colon indicates the item belongs to some namespace
• an underscore is a convention to show the item is an instance of a Class
2- The Classification Group pattern:
A Frameworx classification group can be used for statistics or to apply some action to all members of the group. We used the term “collection” instead of “group” (which might be misinterpreted as a group of people).
3- The Entity/Entity Role pattern:
In this Frameworx pattern an instance can play multiple roles, and the way the instance is related to other instances may depend on which role it is playing. A network element may play a role in the network (e.g. as an edge router, core router, or LAN router), while a person may play a role in an event or an agreement.
In our example below, Joe has several email addresses and the one we use to contact Joe depends on his role.
The diagram is a direct translation of the Frameworx pattern to a knowledge graph. In some cases, we found it was simpler to capture the role as part of a relationship, which is a pattern commonly used in knowledge graphs.
4- The Entity/Entity Specification pattern:
With this Frameworx pattern, attribute values that are common to all instances of the entity are captured in a specification.
For example, identifying a fiber in a cable is always done the same way for a given type of cable. We found that when an attribute can take on multiple values, however, it was simpler to use a category than a specification, as seen in the next example.
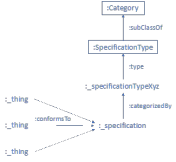
5- The Characteristic Specification/Characteristic Value pattern:
This Frameworx pattern is used to extend the model by adding attributes. We found it useful for modeling any attribute that can take on a fixed set of values. Below is a simple example of sizes (small, medium, or large) to illustrate how we implemented the pattern in a knowledge graph using categories:
By contrast, the Frameworx pattern is more complex; the same information in Frameworx looks like this:
Our knowledge graph implementation is simpler to understand and manage, and it satisfies the original intent of the Frameworx pattern, which is to support extensions of the model as new attributes are discovered.
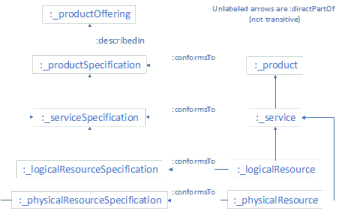
6- The Resource/Service/Product pattern:
This Frameworx pattern models the way products are constructed from the raw materials represented by Resources, with Services as an intermediary. The diagram below shows how we implemented the pattern in a knowledge graph:
The six patterns above illustrate some of the simplifying power of semantics we observed while implementing the Frameworx Information Model in a knowledge graph.
Refactoring the Frameworx Information Model using semantics drops the complexity by nearly an order of magnitude. If you are already using the Frameworx Information Model (TMF SID), this will make it easier for consumers to understand and map into the many distinctions of the telecom domain. If you have not yet adopted the Frameworx Information Model, you might consider this an easier on-ramp.
Semantic Arts has been helping clients bring semantic technology and knowledge graphs to their enterprise applications and enterprise architecture for over twenty years. Five years ago, we crystallized an approach we call the “data-centric approach,” and we continue to refine our methodology and tools to make this approach predictable and repeatable.
Knowledge Graph Modeling: Time Series Micro-Pattern Using gist
For any enterprise, being able to model time series is more than just important, in many cases it is critical. There are many examples, but some trivial ones include “Person is employed By Employer” (Employment date-range), “Business has Business Address” (Established Location date-range), “Manager supervises Member Of Staff” (Supervision date range), and so on. But many developers who dabble in RDF graph modeling end up scratching their heads — how can one pull that off if one can’t add attributes to an edge?
While it is true that one can always model things using either reification or leveraging RDF Quads (see my previous blog semantic rdf properties) now might be a good time to take a step back and explore how the semantic gurus at Semantic Arts have neatly solved how to
model time series starting with version 11 of GIST, their free upper-level ontology (link below).
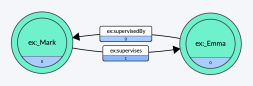
First a little history. The core concept of RDF is to “connect” entities via predicates (a.k.a. “triples”) as shown below. Note that either predicate could be inferred from the other, bearing in mind that you need to maintain at least one explicit predicate between the two, as there is no such thing in RDF as a subject without a predicate/object. Querying such data is also super simple.
So far so good. In fact, this is about as simple as it gets. But what if we wanted to later enrich the above simple semantic relationship with time-series? After all, it is common to want to know WHEN Mark supervised Emma. With out-of-the-box RDF you can’t just hang attributes on the predicates (I’d argue that this simplistic way of thinking is why property graphs tend to be much more comforting to developers).
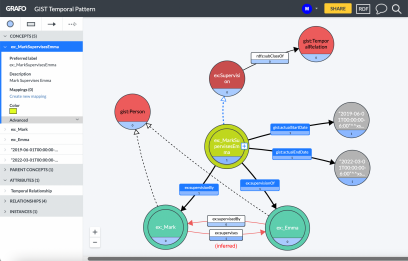
Further, we don’t want to throw out our existing model and go through the onerous task of re-modeling everything in the knowledge graph. Instead, what if we elevated the specific “supervises” relationship between Mark and Emma to become a first-class citizen? What would that look like? I would suggest that a “relation” entity that becomes a placeholder for the “Mark Supervises Emma” relationship would fit the bill. This entity would, in turn, reference Mark via a “supervision by” predicate while referencing Emma via a “supervision of” predicate.
Knowledge Graph Modeling: Time Series Micro-Pattern Using gist
Ok, now that we have a first-class relation entity, we are ready to add additional time attributes (i.e. triples). Well, not so fast! The key insight that in GIST, is that the “actual end date” and “actual start date” predicates as used here specify the precision of the data property (rather than letting the data value specifying the precision), which in our particular use case, we want to be the overall date, not any specific time. Hence our use of gist:actualStartDate and gist:actualEndDate here instead of something more time-precise.
The rest is straightforward as depicted in the micro-pattern diagram shown immediately below. Note that in this case, BOTH the previous “supervised by” and “supervises” predicates connecting Mark to Emma directly can be — and probably should be — inferred! This will allow time-series to evolve and change over time while enabling queryable (inferred) predicates to always be up-to-date and in-sync. It also means that previous queries using the old model will continue to work. A win-win.
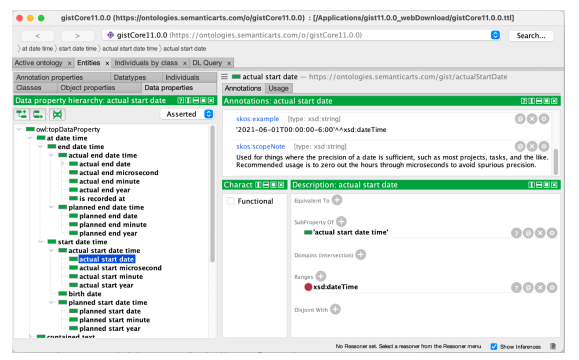
A clever ontological detail not shown here: A temporal relation such as “Mark supervises Emma” must be gist:isConnectedTo a minimum of two objects — this cardinality is defined in the GIST ontology itself and is thus inherited. The result is data integrity managed by the semantic database itself! Additionally, you can see the richness of the GIST “at date time” data properties most clearly in the expression of the hierarchical model in latest v11 ontology (see Protégé screenshot below). This allows the modeler to specify the precision of the start and end date times as well as distinguishing something that is “planned” vs. “actual”.
Overall, a very flexible and extensible upper ontology that will meet most enterprises’ requirements.
Knowledge Graph Modeling: Time Series Micro-Pattern Using gist
Further, this overall micro-pattern, wherein we elevate relationships to first-class status, is infinitely re-purposable in a whole host of other governance and provenance modeling use cases that enterprises typically require. I urge you to explore and expand upon this simple yet powerful pattern and leverage it for things other than time-series!
One more thing…
Given that with this micro-pattern we’ve essentially elevated relations to be first class citizens — just like in classic Object Role Modeling (ORM) — we might want to consider also updating the namespaces of the subject/predicate/object domains to better reflect the objects and roles. After all, this type of notation is much more familiar to developers. For example, the common notation object.instance is much more intuitive than owner.instance. As such, I propose that the traditional/generic use of “ex:” as used previously should be replaced with self-descriptive prefixes that can represent both the owner as well as the object type. This is good for readability and is self-documenting. And ultimately doing so may help developers become more comfortable with RDF/SPARQL over time. For example:
If you have been following my blogs over the past year or so, then you will know I am a big fan of adopting an upper-level ontology to help bootstrap your own bespoke ontology project. Of the available upper-level ontologies I happen to like gist as it embraces a “less is more” philosophy.
Given that this is 3rd party software with its own lifecycle, how does one “merge” such an upper ontology with your own? Like most things in life, there are two primary ways.
CLONE MODEL
This approach is straightforward: simply clone the upper ontology and then modify/extend it directly as if it were your own (being sure to retain any copyright notice). The assumption here is that you will change the “gist” domain into something else like “mydomain”. The benefit is that you don’t have to risk any 3rd party updates affecting your project down the road. The downside is that you lose out on the latest enhancements/improvements over time, which if you wish to adopt, would require you to manually re-factor into your own ontology.
As the inventors of gist have many dozens of man-years of hands-on experience with developing and implementing ontologies for dozens of enterprise customers, this is not an approach I would recommend for most projects.
EXTEND MODEL
Just as when you extend any 3rd party software library you do so in your own namespace, you should also extend an upper-level ontology in your own namespace. This involves just a couple of simple steps:
First, declare your own namespace as an owl ontology, then import the 3rd party upper-level ontology (e.g. gist) into that ontology. Something along the lines of this:
Second, define your “extended” classes and properties, referencing appropriate gist subclasses, subproperties, domains, and/or range assertions as needed. A few samples shown below (where “my” is the prefix for your ontology domain):
my:isFriendOf
a owl:ObjectProperty ;
rdfs:domain gist:Person ;
my:Parent
a owl:Class ;
rdfs:subClassOf gist:Person ;
my:firstName
a owl:DatatypeProperty ;
rdfs:subPropertyOf gist:name ;
The above definitions would allow you to update to new versions of the upper-level ontology* without losing any of your extensions. Simple right?
*When a 3rd party upgrades the upper-level ontology to a new major version — defined as non backward compatible — you may find changes that need to be made to your extension ontology; as a hypothetical example, if Semantic Arts decided to remove the class gist:Person, the assertions made above would no longer be compatible. Fortunately, when it comes to major updates Semantic Arts has consistently provided a set of migration scripts which assist with updating your extended ontology as well as your instance data. Other 3rd parties may or may not follow suit.
The Federal Government and Life Sciences Life Sciences companies are moving toward adoption of the Basic Formal Ontology (BFO).
We have aligned the Semantic Arts foundational ontology (gist) with BFO to help these communities.
This paper describes how and why we did this.
Background
An upper ontology is a high-level data model that can be specialized to create a domain-specific data model. A good upper ontology is a force multiplier that can speed the development of your domain model. It promotes interoperability and can be used as the basis for an information system. Two domain models derived from the same upper ontology are far easier to harmonize.
gist (not an acronym, but the word meaning “get the essence of”) is an upper ontology, focused on the enterprise information systems domain. It was initially developed by Semantic Arts in 2007 and has been refined in over 100 commercial implementation projects. It is available for free under a creative commons’ attribution license at https://www.semanticarts.com/gist/
BFO was developed at the University at Buffalo in 2002 and has been used in hundreds of ontology projects and cited in as many papers. The focus has been on philosophical correctness and has been adopted primarily in life sciences and more recently the federal government. It is available https://basic-formal-ontology.org
BFO and gist share a great deal in common:
Simple – the current version of gist has 211 concepts (98 classes and 113 properties). The current version of BFO has 76 concepts (36 classes and 40 properties). We share the belief that the upper ontology should have the fewest concepts that provide the greatest coverage.
Formality – most of the concepts within both ontologies have very rigorous formal definitions. The axioms within BFO are primarily defined in first order logic, which are not available to the owl-based editors and reasoners – but they have developed an owl version. Half of their definitions are simple subsumption. The other half have subclass restrictions that don’t have as much inferential value as equivalent class axioms. BFO is one of the few other ontologies we have come across that makes extensive use of high-level disjoints. It is the combination of formal definitions with high level disjoints that is the best way to detect logical inconsistencies. gist is also highly axiomized. Half of all gist classes have full formal definitions of the equivalent class variety.
Breadth – both BFO and gist were designed to provide covering concepts for the maximum number of domain concepts. A well-designed domain ontology, derived from either starting point, should have few or no classes that are not derived from the upper ontology classes. In the early days of gist, we created some domain classes without derivation. But as we evolved gist we now find “orphans” (classes not descended from gist classes) to be rare. BFO with its high-level abstract classes certainly has the potential to cover virtually all possible domain classes, but in practice we find many BFO compliant ontologies with large numbers of orphan classes.
Active Evolution – both ontologies are in continual use and have active user communities. Both are well organized with major and minor releases including the ability to accept suggestions from users. Both are being used in production systems throughout the world.
Why Now?
In the early days of semantic adoption there were many options for an upper ontology. BFO, Dolce, Sumo and OpenCyc were considered the main contenders.
At Semantic Arts, we didn’t see a need to adopt BFO or any of the other upper ontologies. They didn’t contain the key concepts that we needed to implement enterprise systems, and they were very hard to explain to subject matter experts and project sponsors. We invest significant effort making sure our ontologies are understood by those that both implement and consume them.
Recently we have considered committing to both schema.org and ISO 15926. Neither of these purports to be an upper ontology. However, when we look at them in detail, we find they are pretty close to being upper ontologies by scope and positioning. In many ways these ontologies are more pragmatic and closer to what we are trying to achieve.
Schema.org is promoted by a consortium led by Google. Its primary use case is to make internet search more accurate by standardizing on many of the terms used for business descriptions. The pragmatic value for companies that tag their content with schema.org is major improvements in web searching. We also know that schema.org can be easily aligned with gist. This is how Schema App (https://www.schemaapp.com ) built their offering. While schema.org is a good solution for finding and describing a company’s offerings, it wasn’t designed for our primary purpose, which is to help a firm run their business.
ISO 15926 emerged from the Oil & Gas industry and is widely used in process manufacturing industries. The architecture is abstract and, in theory, could be applied in a much broader way.
Up until now we didn’t see much advantage in reducing flexibility in the pursuit of our core mission by committing to these candidate upper ontology and upper ontology-like models.
Motivation
We were driven to create an alignment with BFO based on input from some of our clients.
The first motivator is the huge volume of life science ontologies that (at least) purport to be based on BFO. The reason we say “purport” is that we have sampled many life science ontologies for their degree of commitment to BFO. Our measure of commitment is what percentage of their named classes are subclasses of BFO classes. Or to use the terminology earlier, the number of orphan classes they contain. We find many where fewer than half of the classes are proper descendants of BFO primitives.
The OBO (Open Biological and Biomedical Ontologies) Foundry is a great resource for ontologies in the life sciences space. That said, there are over 8 million classes in OBO alone that purport to conform to BFO, which gives other life science ontologies a reason to seek alignment.
The other development was the DoD’s publication of “Principles of The DoD-IC Ontology Foundry” (which is still in draft status). In this document the DoD have declared that all ontology related work within the defense community shall conform to BFO (and the Common Core Ontology, which we will pick up in a subsequent white paper).
For people who must conform to BFO (the defense community) this provides them with a more pragmatic way to build domain models while still complying with the directive. For life science practitioners this also provides assurance that their work will align with life science orthodoxy.
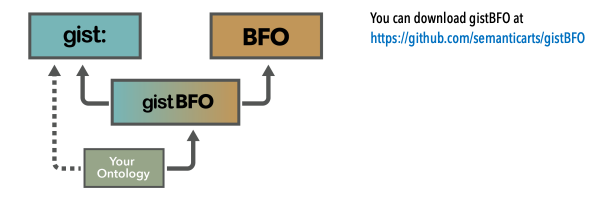
How to Get Started
This illustration shows how the key pieces fit together.
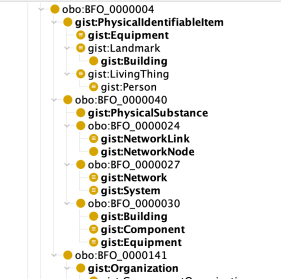
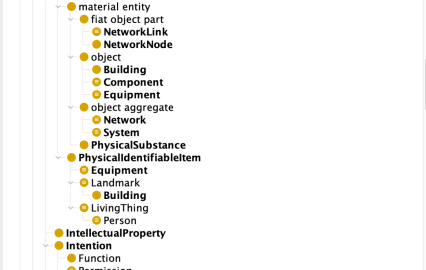
This file will bring in compatible versions of both gist and BFO. These arrows represent the import statements that bring in these ontologies. As we suggest in the tips section you may want to add the redundant import to directly import the same version of gist to your ontology. This is what you will find when you look at the merged ontology in Protege. It is much easier to see which concepts came from BFO and which came from gist when you view using the “Render by prefixed name” option. The BFO class names are in the obo namespace, start with BFO and are numbers.
The capitalized terms starting with gist are from gist.
The alternative display “Render by label (rdfs:label)” it is still pretty easy to tell how they blended together. The BFO labels are lower case. (the order is slightly different because the labels sort differently from the class names, but the hierarchy is the same)
As you will see, almost all the gist classes are proper subclasses of BFO with three exceptions.
Artifact – things that were intentionally built.
Place – locatable in the world
Unit of Measure – a standard amount used to measure or specify things.
The first two of these are convenience classes that group dissimilar items underneath. The “Artifact” class groups physical and non-physical things that were intentionally built. “Place” groups geospatial regions on the earth with physical items that we often refer to as places, such as landmarks and buildings. Because they subsume items that are disjoint, they could not be subsumed under a single BFO class. But each of their subclasses is aligned with BFO so there is no ambiguity there.
We were not sure where “Units of Measure” fit in BFO, so rather than create inconsistencies we opted to leave UoM out of the BFO alignment. CCO went with our first inclination, which was that it was a “generically dependent continuant” (in gist-speak “content”). In fact, CCO went further and said that it was “descriptive information content entity” which I suppose it could be. But these focus on the content-ness of the unit. A case can be made that a unit of measure (say “inch”) is a special case, a reference
case or a magnitude, which in BFO is a “quality,” and more specifically a “relational quality.” For the time being we’ll leave gist:UnitOfMeasure an orphan, but for any specific purpose if people knew that it would be safe, they could declare it a “generically dependent continuant.”
If any of our alignments are inappropriate, we’d be happy to change.
We have done some alignment on the properties. There are some structural differences in the use of properties that will probably cause users of gistBFO to either use gist properties or BFO properties and not mix and match, however where there is some equivalence we’ve recorded.
BFO makes extensive use of inverse properties. There are only 6 properties in BFO that do not have inverses. After years of discouraging the use of inverses, we finally eliminated them altogether in gist. When using an ontology for definitional purposes inverses can be handy, but there are reasons to avoid them in production systems including ambiguity, inconsistency and performance issues. There is a brief white paper here: https://www.semanticarts.com/named-property-inverses-yay-or-nay/ and a longer discussion on here
BFO uses domain and range extensively. Gist uses them sparingly. We have observed in other ontologies being over specific on domain and range has made properties less reusable and contributes to unnecessary concept bloat. Because of the abstractness of BFOs classes this isn’t as much a problem, but it is a stylistic difference.
In BFO there are only four property pairs that participate in any class definitions: location of/located in, continuant part of/ has continuant part, has occurrent part/occurrent part of and has temporal part / temporal part of. We have aligned with these.
Some tips
We recommend anyone using gistBFO, and especially those that are contemplating building artifacts that may be used by BFO and non BFO communities, to primarily rely on the gist concepts when defining your domain specific classes. Doing so will make it far easier to explain to your stakeholders. And it will not sacrifice any of the BFO philosophical grounding as all the gist concepts (except unit of measure) algin with BFO.
The other advantage, suggested by the dotted line in the “how to get started” section, is that if you have defined all your concepts in gist terms, and you need to implement in a non BFO environment you can just drop the import of gistBFO and the BFO references will disappear, and nothing else needs to change.
If you are using BFO and gist in the Life Sciences arena, you might want to consider what we are doing with our Life Sciences clients: treating most of the classes in OBO as instances in an implementation ontology. Depending on your use case this might involve
punning (treating and class and instance interchangeably) or just use the rdfs:seeAlso annotation to resolve the instance to its class.
Coming soon: CCO ready gist
The Common Core Ontology is a DoD initiated project. It is more similar to gist in that the classes are more concrete and more easily understood by domain experts. It is different from gist in that it consists of 1417 classes and 275 properties and is growing. As such it is almost ten times as complex as gist.
We are working on alignment. Stay tuned, coming soon.
The Knowledge Management community has gotten good at extracting and curating knowledge.
There is a confluence of activity – including generative AI models, digital twins and shared ledger capabilities that are having a profound impact on enterprises. Recent research by analysts at Gartner places contextualized information and graph technologies at the center of their impact radar for emerging technologies. This recognition of the importance of these critical enablers to define, contextualize and constrain data for consistency and trust is all part of the maturity process for today’s enterprise. It also is beginning to shine light on the emergence of the Graph Center of Excellence (CoE) as an important contributor to achieving strategic objectives.
For companies who are ready to make the leap from being applications centric to data centric – and for companies that have successfully deployed single-purpose graphs in business silos – the CoE can become the foundation for ensuring data quality and reusability. Instead of transforming data for each new viewpoint or application, the data is stored once in a machine-readable format that retains the original context, connections and meaning that can be used for any purpose.
And now that you have demonstrated value from your initial (lighthouse) project, the pathway to progress primarily centers on the investment in people. The goal at this stage of development is to build a scalable and resilient semantic graph as a data hub for all business-driven use cases. This is where building a Graph CoE becomes a critical asset because the journey to efficiency and enhanced capability must be guided.
Along with the establishment of a Graph CoE, enterprises should focus on the creation of a “use case tree” or “business capability model” to identify where the data in the graph can be extended. This is designed to identify business priorities and must be aligned with the data from initial use cases. The objective is to create a reusable architectural framework and a roadmap to deliver incremental value and capitalize on the benefits of content reusability. Breakthrough progress comes from having dedicated resources for the design, construction and support of the foundational knowledge graph.
The Graph CoE would most logically be an extension of the Office of Data Management and the domain of the Chief Data Officer. It is a strategic initiative that focuses on the adoption of semantic standards and the deployment of knowledge graphs across the enterprise. The goal is to establish best practices, implement governance and provide expertise in the development and use of the knowledge graph. Think of it as both the
hub of graph activities within your organization and the mechanism to influence organizational culture.
Some of the key elements of the Graph CoE include:
• Information Literacy: A Graph CoE is the best approach to ensure organizational understanding of the root causes and liabilities resulting from technology fragmentation and misalignment of data across repositories. It is the organizational advocate for new approaches to data management. The message for all senior executive stakeholders is to both understand the causes of the data dilemma and recognize that properly managed data is an achievable objective. Information literacy and cognition about the data pathway forward is worthy of being elevated as a ‘top-of-the-house’ priority.
• Organizational Strategy: One of the fundamental tasks of the Graph CoE is to define the overall strategy for leveraging knowledge graphs within the organization. This includes defining the underlying drivers (i.e., cost containment, process automation, flexible query, regulatory compliance, governance simplification) and prioritizing use cases (i.e., data integration, digitalization, enterprise search, lineage traceability, cybersecurity, access control). The opportunities exist when you gain trust across stakeholders that there is a path to ensure that data is true to original intent, defined at a granular level and in a format that is traceable, testable and flexible to use.
• Data Governance: The Graph CoE is responsible for establishing data policies and standards to ensure that the semantic layer is built using wise engineering principles that emphasize simplicity and reusability. When combining resolvable identity with precise meaning, quality validation and data lineage – governance shifts away from manual reconciliation. With a knowledge graph at the foundation, organizations can create a connected inventory of what data exists, how it is classified, where it resides, who is responsible, how it is used and how it moves across systems. This changes the governance operating model – by simplifying and automating it.
• Knowledge Graph Development: The Graph CoE should lead the development of each of the knowledge graph components. This includes working with subject matter experts to prioritize business objectives and build use case relationships. Building data and knowledge models, data onboarding, ontology development, source-to-target mapping, identity and meaning resolution and testing are all areas of activity to address. One of the critical components is the user experience and data extraction capabilities. Tools should be easy to use and help teams do their job faster and better. Remember, people have an emotional connection to the way they work. Win them over with visualization. Invest in the user interface. Let them gain hands-on experience using the graph. The goal should be to create value without really caring what is being used at the backend.
• Cross-Functional Collaboration: The pathway to success starts with the clear and visible articulation of support by executive management. It is both essential and meaningful because it drives organizational priorities. The lynchpin, however, involves cooperation and interaction among teams from related departments to deploy and leverage the graph capabilities most effectively. Domain experts from technology are required to provide the building blocks for developing applications and services that leverage the graph. Business users identify and prioritize use cases to ensure the graph addresses their evolving requirements. Governance policies need to be aligned with insights from data stewards and compliance officers. Managing the collaboration is essential for orchestrating the successful shift from applications-centric to data-centric across the enterprise.
After successfully navigating the initial stages of your project, the onward pathway to progress should focus on the development of the team of involved stakeholders. The first hurdle is to expand the identity of data owners who know the location and health of the data. Much of this is about organizational dynamics and understanding who the players are, who is trusted, who is feared, who elicits cooperation and who is out to kill the activity.
This coincides with the development of an action plan and the assembly of the team of skilled practitioners needed to ensure success. Enterprises will need an experienced architect who understands the workings of semantic technologies and knowledge graphs to lead the team. The CoE will need ontologists to engineer content and manage the mapping of data. Knowledge graph engineers are needed to coordinate the meaning of data, knowledge and content models. This will also require a project manager to be an advocate for the team and the development process.
And a final note, organizations working on their AI readiness must understand it requires being ready from the perspective of people, technology and data. The AI-ready data component means incorporating context with the data. Gartner points this out by noting that it necessitates a shift from the traditional ETL mindset to a new ECL (extract, contextualize and load) orientation. This ensures meaningful data connections. Gartner advises enterprises to leverage semantic metadata as the core for facilitating data connections.
The Graph CoE is an important step in transforming your lighthouse project or silo deployment into a true enterprise platform. A well-structured CoE should be viewed as a driver of innovation and agility within the enterprise that facilitates better data integration, improves operational efficiency, contextualizes AI and enhances the user experience. It is the catalyst for building organizational capabilities for long-term strategic advantage and one of the key steps in the digital transformation journey.
I read “How Big Things Get Done” when it first came out about six months ago.[1] I liked it then. But recently, I read another review of it, and another coin dropped. I’ll let you know what the coin was toward the end of this article, but first I need to give you my own review of this highly recommended book.
The prime author, Bent Flyvbjerg, is a professor of “Economic Geography” (whatever that is) and has a great deal of experience with engineering and architecture. Early in his career, he was puzzling over why mass transit projects seemed routinely to go wildly over budget. He examined many in great detail; some of his stories border on the comical, except for the money and disappointment that each new round brought.
He was looking for patterns, for causes. He began building a database of projects. He started with a database of 178 mass transit projects, but gradually branched out.
It turns out there wasn’t anything especially unique about mass transit projects. Lots of large projects go wildly over budget and schedule, but the question was: Why?
It’s not all doom and gloom and naysaying. He has some inspirational chapters about the construction of the Empire State Building, the Hoover Dam, and the Guggenheim Museum in Bilbao. All of these were in the rarified atmosphere of the less than ½ of 1% of projects that came in on time and on budget.
Flyvbjerg contrasted them with a friend’s brownstone renovation, California’s bullet train to nowhere, the Pentagon (it is five-sided because the originally proposed site had roads on five sides), and the Sydney Opera House. The Sydney Opera House was a disaster of such magnitude that the young architect who designed it never got another commission for the rest of his career.
Each of the major projects in his database has key considerations, such as original budget and schedule and final cost and delivery. The database is organized by type of project (nuclear power generation versus road construction, for instance). The current version of the database has 38,000 projects. From this database, he can calculate the average amount projects run over budget by project type.
IT Projects
He eventually discovered IT projects. He finds them to be among the most likely projects to run over budget. According to his database, IT projects run over budget by an average of 73%. This database is probably skewed toward larger projects and more public ones, but this should still be of concern to anyone who sponsors IT projects.
He described some of my favorites in the book, including healthcare.gov. In general, I think he got it mostly right. Reading between the lines, though, he seems to think there is a logical minimum that the software projects should be striving for, and therefore he may be underestimating how bad things really are.
This makes sense from his engineering/architecture background. For instance, the Hoover Dam has 4.3 million cubic yards of concrete. You might imagine a design that could have removed 10 or 20% of that, but any successful dam-building project would involve nearly 4 million cubic yards of concrete. If you can figure out how much that amount of concrete costs and what it would take to get it to the site and installed, you have a pretty good idea of what the logical minimal possible cost of the dam would be.
I think he assumed that early estimates for the cost of large software projects, such as healthcare.gov at $93 million, may have been closer to the logical minimum price, which just escalated from there, to $2.1 billion.
What he didn’t realize, but readers of Software Wasteland[2] as well as users of healthsherpa.com[3] did, was that the actual cost to implement the functionality of healthcare.gov is far less than $2 million; not the $93 million originally proposed, and certainly not the $2.1 billion it eventually cost. He likely reported healthcare.gov as a 2,100% overrun (final budget of $2.1 billion / original estimate of $93 million). This is what I call the “should cost” overrun. But the “could cost” overrun was closer to 100,000% (one hundred thousand percent, which is a thousand-fold excess cost).
From his database, he finds that IT projects are in the top 20%, but not the worst if you use average overrun as your metric.
He has another metric that is also interesting called the “fat tail.” If you imagine the distribution of project overruns around a mean, there are two tails to the bell curve, one on the left (projects that overrun less than average) and one on the right for projects that overrun more than average. If overruns were normally distributed, you would expect 68% of the projects to be within one standard deviation of the mean and 94% within two standard deviations. But that’s not what you find with IT projects. Once they go over, they have a very good chance of going way over, which means the right side of the bell curve goes kind of horizontal. He calls this a “fat tail.” IT projects have the fattest tails of all the projects in his database.
IT Project Contingency
Most large projects have “contingency budgets.” That is an amount of money set aside in case something goes wrong.
If the average large IT project goes over budget by 73%, you would think that most IT project managers would use a number close to this for their contingency budget. That way, they would hit their budget-with-contingency half the time.
If you were to submit a project plan with a 70% contingency, you would be laughed out of the capital committee. They would think that you have no idea how to manage a project of this magnitude. And they would be right. So instead, you put a 15% contingency (on top of the 15% contingency your systems integrator put in there) and hope for the best. Most of the time, this turns out badly, and half the time, this turns out disastrously (in the “fat tail” where you run over by 447%). As Dave Barry always says, “I am not making this up.”
Legacy Modernization
These days, many of the large IT projects are legacy modernization projects. Legacy modernization means replacing technology that is obsolete with technology that is merely obsolescent, or soon to become so. These days, a legacy modernization project might be replacing Cobol code with Java.
It’s remarkable how many of these there are. Some come about because programming languages become obsolete (really it just becomes too hard to find programmers to work on code that is no longer padding their resumes). Far more common are vendor-forced migrations. “We will no longer support version 14.4 or earlier; clients will be required to upgrade.” What used to be an idle threat is now mandatory, as staying current is essential in order to have access to zero-day security patches.
When a vendor-forced upgrade is announced, often the client realizes this won’t be as easy as it sounds (mostly because the large number of modifications, extensions, and configurations they have made to the package over the years are going to be very hard to migrate). Besides, having been held hostage by the vendor for all this time, they are typically ready for a break. And so, they often put it out to bid, and bring in a new vendor.
What is it about these projects that are so rife? Flyvbjerg touches on it in the book. I will elaborate here.
Remember when your company implemented its first payroll system? Of course you don’t, unless you are, like, 90 years old. Trust me, everyone implemented their first automated payroll system in the 1950s and 1960s (so I’m told, I wasn’t there either). They implemented them with some of the worst technology you can imagine. Mainframe Basic Assembler Language and punched cards were state of the art on some of those early projects. These projects typically took dozens of person years (OK, back in those days they really were man years) to complete. This would be $2-5 million at today’s wages.
These days, we have modern programming languages, tools, and hardware that is literally millions of times more powerful than what was available to our ancestors. As such, a payroll system implementation in a major company is a multi-hundred million undertaking these days. “Wait, Dave, are you saying that the cost of implementing something as bog standard as a payroll system has gone up a factor of 100, while the technology used to implement it has improved massively?” Yes, that is exactly what I’m saying.
To understand how this could be you might consult this diagram.
This is an actual diagram from a project with a mid-sized (7,000-person) company. Each box represents an application and each line an interface. Some are APIs, some are ETLs, and some are manual. All must be supported through any conversion.
My analogy is with heart transplantation. Any butcher worth their cleaving knife could remove one person’s heart and put in another in a few minutes. That isn’t the hard part. The hard part is keeping the patient alive through the procedure and hooking up all those arteries, veins, nerves, and whatever else needs to be restored. You don’t get to quit when you’re half done.
And so it is with legacy modernization. Think of any of those boxes in the above diagram as a critical organ. Replacing it involves reattaching all those pink lines (plus a bunch more you don’t even know are there).
DIMHRS was the infamous DoD project to upgrade their HR systems. They gave up with north of a billion dollars invested when they realized they likely only had about 20% of the interfaces completed and they weren’t even sure what the final number would be.
Back to Flyvbjerg’s Book
We can learn a lot by looking at the industries where projects run over the most and run over the least. The five types of projects that run over the most are:
Nuclear storage
Olympic Games
Nuclear power
Hydroelectric dams
IT
To paraphrase Tolstoy, “All happy projects are alike; each unhappy project is unhappy in its own way.”
The unhappiness varies. The Olympics is mostly political. Sponsors know the project is going to run wildly over, but want to do the project anyway, so they lowball the first estimate. Once the city commits, they have little choice but to build all the stadiums and temporary guest accommodations. One thing all of these have in common is they are “all or nothing” projects. When you’ve spent half the budget on a nuclear reactor, you don’t have anything useful. When you have spent 80% of the budget and the vendor tells you you are half done, you have few choices other than to proceed. Your half a nuclear plant is likely more liability than asset.
Capital Project Riskiness by Industry [4]
And so it is with most IT projects. Half a legacy modernization project is nothing.
Now let’s look at the bottom of Flyvbjerg’s table:
Roads
Pipelines
Wind power
Electrical transmission
Solar power
Roads. Really? That’s how bad the other 20 categories are.
What do these have in common? Especially wind and solar.
They are modular. Not modular as in made of parts, even nuclear power is modular in some fashion. They are modular in how their value is delivered. If you plan a wind project with 100 turbines, then when you have installed 10, you are generating 10% of the power you hoped the whole project would. You can stop at this point if you want (you probably won’t as you’re coming in on budget and getting results).
In my mind, this is one reason I think wind and solar are going to outpace most predictions of their growth. It’s not because they are green, or even that they are more economical — they are — but they are also far more predictable and lower risk. People who invest capital like that.
Data-Centric as the Modular Approach to Digital Transformation
That’s when the coin dropped.
What we have done with data-centric is create a modular way to convert an enterprise’s entire data landscape. If we pitched it as one big monolithic project, it would likely be hundreds of millions of dollars, and by the logic above, high risk and very likely to go way over budget.
But instead, we have built a methodology that allows clients to migrate toward data-centric one modest sized project at a time. At the end of each project, the client has something of value they didn’t have before, and they have convinced more people within their organization of the validity of the idea.
Briefly how this works:
Design an enterprise ontology. This is the scaffolding that prevents subsequent projects from merely re-platforming existing silos into neo-ilos.
Load data from several systems into a knowledge graph (KG) that conforms to the ontology in a sandbox. This is nondestructive. No production systems are touched.
Update the load process to be live. This does introduce some redundant interfaces. It does not require any changes, but some additions to the spaghetti diagram (this is all for the long-term good).
Grow the domain footprint. Each project can add more sources to the knowledge graph. Because of the ontology, the flexibility of the graph and the almost free integration properties of RDF technology, each domain adds more value, through integration, to the whole.
Add capability to the KG architecture. At first, this will be view-only capability. Visualizations are a popular first capability. Natural language search is another. Eventually, firms add composable and navigable interfaces, wiki-like. Each capability is its own project and is modular and additive as described above. If any project fails, it doesn’t impact anything else.
Add live transaction capture. This is the inflection point. Up to this point, the project was a richer and more integrated data warehouse. Up to this point, the system relied on the legacy systems for all the information, much as a data warehouse does. At this junction, you implement the ability to build use cases directly on the graph. These use cases are not bound to each other in the way that monolithic legacy system use cases are. These use cases are bound only to the ontology and therefore are extremely modular.
Make the KG the system of record. With the use case capability in place, the graph can become the source system and system of record for some data. Any data sourced directly in the graph no longer needs to be fed from the legacy system. People can continue to update it in the legacy system if there are other legacy systems that depend on it, but over time, portions of the legacy system will atrophy.
Legacy avoidance. We are beginning to see clients who are far enough down this path that they have broken the cycle of dependence they have been locked into for decades. The cycle is: If we have a business problem, we need to implement another application to solve it. It’s too hard to modify an existing system, so let’s build another. Once a client starts to get to critical mass in some subset of their business, they begin to become less eager to leap into another neo-legacy project.
Legacy erosion. As the KG becomes less dependent on the legacy systems, the users can begin partitioning off parts of it and decommissioning them a bit at a time. This takes a bit of study to work through the dependencies, but is definitely worth it.
Legacy replacement. When most of the legacy systems data is already in the graph, and many of the use cases have been built, managers can finally propose a low-risk replacement project. Those pesky interface lines are still there, but there are two strategies that can be used in parallel to deal with them. One is to start the furthest downstream, with the legacy systems that are fed, but do little feeding of others. The other strategy is to replicate the interface functionality, but from the graph.
We have done dozens of these projects. This approach works. It is modular, predictable, and low-risk.
If you want to talk to someone about getting on a path of modular modernization that really works, look us up.