In the last two months I’ve heard at least 6 financial institutions declare that they intended to become “A Semantic Bank.” We still haven’t seen even the slightest glimmer as to what any of them mean by that.
Allow me to step into that breach.
What follows is our take on what it would mean to be a “Semantic Bank.”
The End Game
I’m reluctant to start with the end state, because pretty much anyone reading this, including those who aspire to be semantic banks, will find this to be a “bridge too far.” Bear with me. I know this will take at least a decade, perhaps longer to achieve. However, having the end in mind, allows us to understand with a clarity few currently have, exactly where it is we are wasting our money now.
If we had the benefit of time and could look back from 2026 and ask ourselves “which of our investments in 2016 were really investments, and which were wastes of money?” how would we handicap the projects we are now funding? Now to be clear, not all expenditures need to be leading to the semantic future. There are tactical projects that are worth so much in the short term that we can overlook the fact that we are anti-investing the future. But we should be aware of when we are doing this, and it should be an exception. The semantic bank of the future will be the organization that can intentionally divert the greatest percent of their current IT capital spend toward their semantic future.
A Semantic Bank will be known by the extent to which its information systems are mediated by a single (potentially fractal, but with a single simple core) conceptual model. Unlike conceptual models of the past, this one will be directly implemented. That is, a query to the conceptual model will return production data, and a transaction expressed in conceptual model terms will be committed, subject to permissions and constraints which will also be semantically described.
Semantics?
For those who just wandered into this conversation: semantics is the study of meaning. Semantic Technology allows us to implement systems, and to integrate systems at the level of conceptual meaning, rather that the level of structural description (which is what traditional technology relies on).
It may sound like a bit of hair splitting, but the hair splitting is very significant in this case. This technology allows practitioners to drop the costs of development, integration and change by over an order of magnitude, and allows incorporation of data types (unstructured, semi structure and social media for instance) that hitherto were difficult to impossible to integrate.
It accomplishes this through a couple of interesting departures from traditional development:
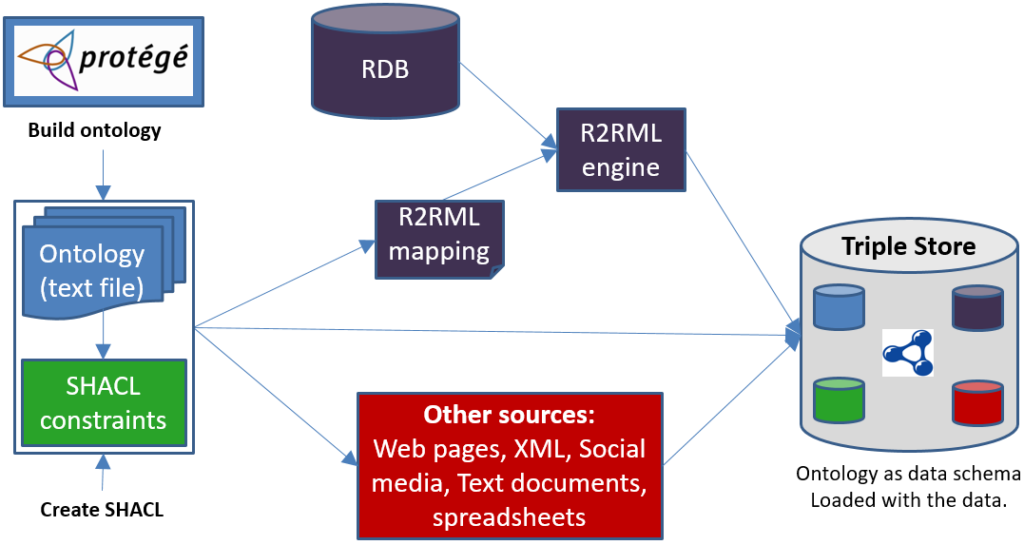
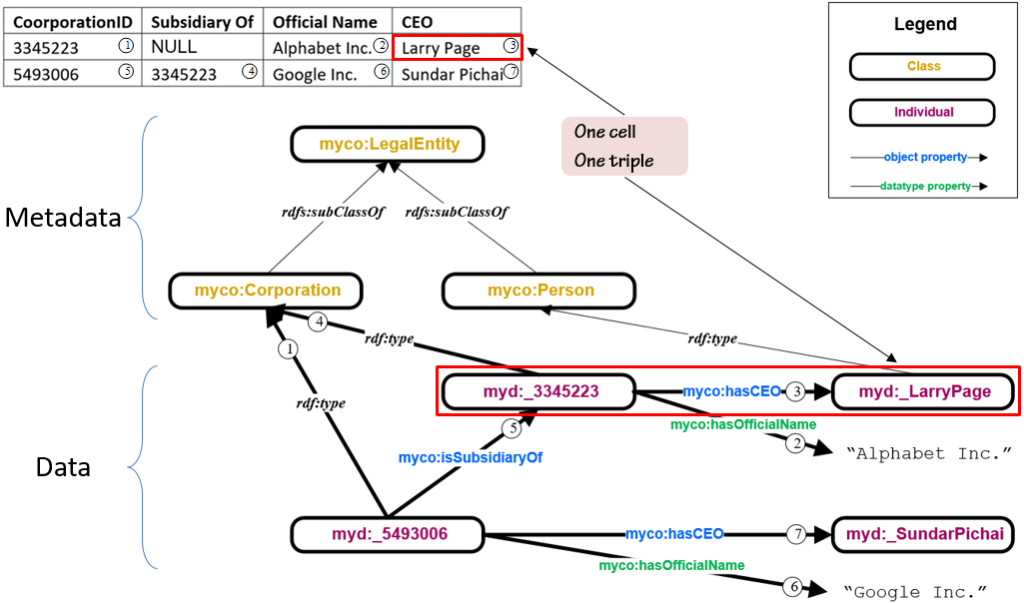
- All data is represented in a single format (the triple). There aren’t hundreds or thousands of different tables, there is just the triple.
- Each triple is an assertion, a mini sentence composed of a subject, predicate and object. All data can be reduced to a set of triples.
- All the subjects, all the predicates, and most of the objects are identified with globally unique identifiers (URIs, which are analogous to URLs)
- Because the identifiers are globally unique, the system can join records, without an analyst or programming having to write the explicit joins.
- A database that assembles triples like this, is called a “triple store” and is in the family of “graph databases.” A semantic triple store is different from a non semantic database in that it is standards compliant and supports a very rich schema (even though it is not dependent on having a schema).
- Every individually identifiable thing (whether a person, a bank account or even the concept of “Bank Account”) is given a uri. Whereever the uri is stored or used it always means exactly the same thing. Meaning is not dependent on context or location.
- New concepts can be formed by combining existing concepts.
- The schema can evolve in place, even in the presence of a very large database dependent on it.
A set of concepts so defined is called an “Ontology” (loosely an organized body of knowledge). When the definitions are shared at the level of the firm, this is called an “Enterprise Ontology.”
Our experience has been that using these semantic approaches an ontology can be radically simpler, and at the same time more precise and more complete, than traditional application databases. When the semantics are done at the firm level the benefits are even greater, because each additional application is benefiting from the concepts shared with the others.
Business Value
What is the business value of rethinking information systems? They come in two main varieties: generic and specific.
Generic Value
Dropping the cost of change by a factor of 10 has all sorts of positive value. Systems that were too difficult to change become malleable.
The integration story is even better: once all the similar concepts are expressed in a way that their similarity is obvious and baked into their identity, systems integration, currently one of the largest costs in IT will become almost free
Back to the End Game
In the end game, a semantic bank will have all their systems directly implemented on a shared semantic model. The scary thing is: who has a better shot at this, the established oligarchy (the “too big to fail”) or FinTech? Each have about half the advantages. Queue Clayton Christiansen’s “Innovators Dilemma” : in some situations a new upstart enters a market with superior technology and the incumbents crush the upstart. In other situations, the upstart creates a beachhead in an underserved market and continually walks their way up the value chain until the incumbents are on the ropes. What is the difference and how will it play out with the “Semantic Banks?” is the ultimate question.
A Bit More on the Target
Most vendors have a tendency to see the future in terms of the next version of their offering.
In the future, a progressive firm will have an “enterprise ontology” that represents the key concepts that they deal with. Currently they have thousands of application systems, each of which has thousands of tables, and tens of thousands of columns that they manage. In aggregate they are managing millions of concepts.
But really, there are a few hundred concepts that everything they deal with are based on. When we figure out what these few hundred concepts, we have started down the road of profound simplicity.
Once you have this model (the “core ontology”) you are armed with a weapon that delivers on three fronts:
- All integration can be mediated through this model. By mapping into and out of the shared model, all integration becomes easier
- New development can be made incredibly simpler. Building an app on a model that is 10 times simpler than normal and 100 times simpler than the collective model of the firm, economizes the application development and integration process.
- The economics of change become manageable. Currently there is such a penalty for changing an information system, that we spend inordinate amount of energy staving off changes. In the semantic future change is economically (not free but far far less than current costs). Once we get to that point, the low cost of change translates into rapidly evolvable systems.
What Will Distinguish the Leaders in the Next Five Years?
Only the smallest start up will be completely semantic within the next five years. If they develop a semantic core, their challenge will be growing out to overtake the incumbents.
This white paper is mostly written for the incumbents (by the way we are happy to help FinTech startups, but our core market is established players dealing with legacy issues) .
Most financial services companies right now are executing “proof of concept” projects. Those that do this may well be the losers. NASA has a concept called “TRL” (Technology Readiness Level) they have a scale of 1-9 with 1-3 being levels wacky ideas that no one has any idea whether they could be implemented to 7-9 being technology that has already been commercialized and there is no more risk left in implementation. Experiments are typically done in level 1-3, to learn what else do we need to know to make this technology real. Proofs of Concept are typically done in levels 4-6 to narrow down some implementation parameters. The issue is, all the important semantic technology is at level 8 or 9. Everyone knows it works and knows how it works. The companies who are doing “proof of concept projects” in semantic technology at this point are vamping[1] and will ultimately be eclipsed by companies who can commit when appropriate.
What are the benefits of becoming semantic?
The benefits of adopting this approach are so favorable that many people would challenge our credibility for suggesting them (sounds like hype) but these differences are really true, so we won’t shrink from our responsibility for the sake of credibility.
Integration
When you map your existing (and especially future) systems to a simple, shared model, the cost of integration plummets. Currently integration consumes 30-60% of the already bloated IT budget because analysts are essentially negotiating agreement between systems that each have tens of thousands of concepts. That’s hard.
What’s easy (well relatively easy) is to maps a complex system to a simple model. Once you’ve done this, it is integrated to all the other systems that have also been mapped to that model. It becomes the network effect of knowledge.
Application Development
A great deal of the cost of application development is the cost of programming to a complex data model. Semantic Technology helps at two levels. The first level is by reducing the complexity of the model, any code dependent on the model is reduced proportionately. The second level is that semantic technology is very compatible with RESTful development. The RESTful approach encourages a style of development that is less dependent on and less coupled to, the existing schema. We have found that a semantic based system using RESTful APIs is amazingly resilient to changes in the model (other than those that introduce major structural changes, but that is a commercial for getting your core ontology right to start with)
New Data Types
Many leading edge projects are predicated on being able to incorporate data that was hitherto unrealistic to incorporate. This might be unstructured data, it might be open data, it might we social media. All of these are difficult for traditional technology, but semantic technology takes in stride.
Observations from other industries
Our observation about what has worked in other industries (which by the way are also minimally converted to semantic technology, but the early adopters provide some important signposts for what works and what doesn’t)
Vision and Constancy Trump Moon Shots
What we have seen from the firms that have implemented impressive architectures based on semantics, is that a small team, with continual funding vastly outperforms attempts to catch up with huge projects. The most impressive firms have had a core of 3-8 people who were at it continually for 2-4 years. Once you reach critical mass with these teams and the capability they create, putting 50-100 people on a catch up project will never catch them. The lead that can be established now with a small focused team, will open up an insurmountable lead 3-5 years from now, when this movement becomes obvious.
The Semantic Bank Maturity Model
Eventually we will come to the point where we will want to know “how semantic are you?” Click here to take an assessment to discover the answer to this questions.
We will take this up in a separate white paper, with considerably more detail, but the central concept is: what percent of your data stores are semantically enabled and how semantic are they really?
Getting Started
Let’s assume you want to take this on and become a “Semantic Bank”. How do you go about it?
What we know from other industries is the winner is not the firm that spends the most, or even who starts first (although at some point failing to start is going to be starting to fail). The issue is who can have a modest, but continual initiative. This means that the winner will be the firm that can finance a continual improvement project over several years. While you might make a bit of incremental progress through a series of tactic projects, the big wins will come from the companies that can set up an initiative and stick with it. We have seen this in healthcare, manufacturing and publishing, we expect it to be true in financial services as well.
Often this means that the sponsor must be at a position where they can dedicate a continual (but not very large) budget to achieve this goal. If that is not you, you may want to start the conversation with the person who can make a difference. If this is you, what are you waiting for?
[1] Vamping is term professional jugglers use to refer to the act you perform when you drop a juggling club. Vamping is the process of continuing the cadence with an imaginary club until you can find a moment to lift the dropped club back into the rotation.


 confluence of several interesting conclusions the community has come to. The first was that being agile means being able to make a simple change to a system in a limited amount of time, and being able to test it easily. That sounds like a goal anyone could get behind, and yet, this is nearly impossible in a legacy environment. Agile proponents know that any well-intentioned agile system is only six months’ worth of entropy away from devolving into that same sad state where small changes take big effort.