
Fractal geometry creates beautiful patterns from simple recursive algorithms. One of the things we find so appealing is their “self-similarity” at different scales. That is, as you zoom in to look at a detail under more magnification you see many of the same patterns that were visible when zoomed out at the macro level.
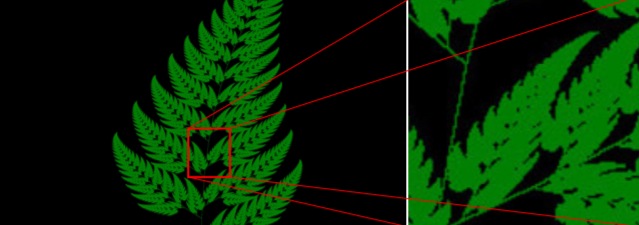
After decades of working with clients at large organizations, I’ve concluded that they secretly would like to have a fractal approach to managing all their data. I say this desire is secret for several reasons:
- No one has ever used that term in my presence
- What they currently have is 180 degrees away from a fractal landscape
- They probably haven’t been exposed to any technology or approach that would make this possible
And yet, we know this is what they want. It exists in part in a small subset of their data. The ability to “drill down” on predefined dimensions gives a taste of what is possible, but it is limited to that subset of the data. It exists in small measure in any corpus made zoom-able by faceted categorization, but it is far from the universal organizing principle that it could be.
Several of the projects we have worked on over the last few years have allowed us to triangulate in on exactly this capability. This fractal approach leads us to information-scapes that have these characteristics:
- They are understandable
- They are pre-conditioned for easy integration
- They are less likely to be loaded with ambiguity
The Anti-fractal data landscape
The data landscape of most large enterprises looks alike:
- There are tens of thousands to hundreds of thousands of database tables.
- In hundreds to thousands of applications
- In total there are hundreds of thousands to millions of attributes
There is nothing fractal about this. It is a vast, detailed data landscape, with no organizing principle. The only thing that might stand in for an organizing principle is the bounds of the application, which actually makes matters worse. The presence of applications allow us to take data that is similar, and structure it differently, categorize it differently, and name it differently. Rather than provide an organizing principle, applications make understanding our data more difficult.
And this is just the internal/ structured data. There is far more data that is unstructured (and we have nearly nothing to help us now with unstructured data), external (ditto) and “big data” (double ditto).
The road to fractal nirvana
Our journey to discover this, took quite a long time. Now that we know, we can help you through the journey much more rapidly.
Enterprise Ontologies
Our journey began with our work on enterprise ontologies. We were and are big believers in the value of enterprise data modeling. We also recognized that enterprise data modeling had out run its own supply line. That is, most organizations had such complex data schemas that the possibility of creating an enterprise data model was infeasible.
Our work with formal ontologies, and OWL in particular led us to techniques that could be applied at the enterprise level. From 2006-2012 we produced about a dozen large scale enterprise ontologies, for companies in a wide range of industries.
We discovered through these projects that most large enterprises could be modeled with between 1000 and 2000 concepts.
Structure free models
It took us quite a while, between our work with enterprise ontologies and our teaching the leading class in designing ontologies, before the value of the structure free model became apparent.
We got further into the value of structure free models when we began implementing model driven applications driven from the enterprise ontology.
Traditional applications make a deep commitment to the structure of the data model and therefore the database schema. Code is written to that structure, and therefore when the structure changes the application code must change. This is one of the main reasons that applications are as inflexible as they are.
Semantic systems represent everything (data as well as metadata) in “triples.” These triples self-assemble into graphs. The graph has no a priori structure, and two instances of the same type can easily have differently structured graphs.
gist
In parallel with our work on Enterprise Ontologies, we developed gist. We call gist the “minimalist upper ontology” by which we mean: “what are the fewest number of concepts that are shared by most business applications, would be generally understood by most application developers and would cover most of the concepts found in an enterprise ontology.” Gist is freely available through a creative commons share alike license.
From the first version of gist, through to gist 6.7 we had been vacillating around 200 key concepts. We built a number of “sub gists” (which were subdomains where we took things to a lower level of detail or elaborated something that was industry specific) which in total were probably 3-4 times the size of the core gist.
An associate, Arka Mukherjee, made the suggestion to take gist one step further and get prominent businesses to vet each piece separately (Pitney Bowes could vet the address ontology, Dunn & Bradstreet could vet the organization ontology, etc.). This is an excellent idea, and we are organizing ourselves to take this on. In the process of refactoring gist we made some very interesting observations. By the time you read this gist 8.0, with the aforementioned feature, will likely be available on our web site, but if not just drop us a line and we’ll get you a pre-release version.
The new and improved gist 8.0 is about 100 concepts in total (classes plus properties). It is subdivided into 12 modules, each of which has on average 8 concepts. There are dependencies between the modules, for instance the time module relies on the place module for its definition of a time zone as a geographical region. The surprising thing is how much simpler it is. We thought gist 6.7 was simple (and it was, we know of no other ontology that covers the breadth of domains more elegantly), but gist 8.0 takes it to a new level.
We are now leagues ahead in the race for simplicity, which we think is the important race to be involved in. You could unambiguously define a league in two triples if you imported the gist unit of measure ontology.

This graphical notation says that a league has the base unit of meter (one triple) and it converts to that base by multiplying it by 4828.0417 (second triple). When you import the gist Unit of Measure ontology and run the reasoner you will find that league has been inferred to be a “DistanceUnit.” If we were to further declare some distance in leagues, (and imported gist Magnitude) the distance would be inferred to be an extent, and we would then be able to convert it to a magnitude in any other defined distance unit. (You can’t do the conversion in owl, but it sets it up for a very simple algorithm).
What we learned in modularizing gist, caused us to rethink how we modularize our enterprise ontologies.
Modular Enterprise Ontologies
We have since built a methodology around what we found here. While the enterprise ontologies we’ve built to date, were simple and modular, we now realize how much simpler and more modular they could be.
Furthermore, partly based on what we are learning from building out applications, we are now more resolved to make sure all enterprise classes have parents in gist.
These observations are making enterprise ontologies possible that can be assembled for a given purpose and which do not have more concepts than needed for the problem at hand.
Taxonomies in the Context of Ontologies
We can take the idea of fractal structure one step further.
Two of our recent projects have involved incorporating taxonomies into an ontological framework.
As we knew going in, taxonomies are far less rigorous than ontologies, and don’t have relationships or membership definition as ontologies do. For a long time this caused us to discount taxonomies in favor of the richer class structures of ontologies.
But our clients persisted, for many reasons. Sometimes it’s because they don’t understand ontologies. Sometimes it’s because they acquired a tool that uses taxonomies. Often it’s because taxonomies are easier to set up a governance structure around.
As we dove in we discovered that taxonomies, if well designed and designed in the context of an ontology, could be very complementary. Rather than fighting the taxonomy/ontology wars, we could make peace. And this peace results in the ontology being far simpler. Any distinction that can be shuttled off to a taxonomy has reduced complexity in the ontology and made it easier to govern. Conversely, when taxonomies are put into the context of an ontology they become much simpler and easier to govern.
The taxonomies are becoming the low level detail in the fractal data landscape.
Example
Let me describe how this works (perhaps latter we can show with some advanced visualizations that don’t yet exist).
At the top / zoomed out level of an enterprise (especially one derived from gist) we would have these major concepts, covering nearly everything they do:
- Time
- Place
- Person
- Organization
- Physical Item
- Measurement
- Unit of Measure
- Document
- Event
- Temporal Relation
- Behavior
- Goal
- Agreement
As we zoom in on a healthcare organization we might find specializations of Person, such as Employee, Physician, Nurse, Patient, and Beneficiary. As we drill (fractally) further down we may find more subclasses (types of employees) or we may go straight to the classically taxonomic distinctions such as “exempt” and “non exempt.”
Visualization
We haven’t worked through a generalized way to visualize these fractal data models, but we are working on it.
The “crop circle” metaphor turns out to not scale well. The problem is that the logically correct idea, that subtypes should be inside their parents (in a venn diagram sense) turns out to not work well visually.
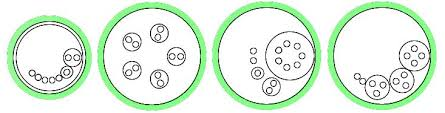
We are working on some interactive displays that seem to have some promise, but they are not quite ready for display.
Using an enterprise fractal data model
There are two aspects to using such a model. The first is defining it. It takes a fair bit of work to get the distinctions right, complete, elegant, and fractal all at the same time.
But assuming that has been completed, the next task is to wire up as many of your data sources as possible. Each source may have a different strategy. Some you may leave in their relational databases and link in in a federated fashion. You may choose to publish sparql endpoints to allow the dynamic request to be presented. For some sources you may triplify the information and post it to a triple store. Unstructured data can be harvested via Named Entity Extraction and Relationship Extraction. In order to be useful they still need to be harmonized to the shared model.
In all cases you will be mapping the source to the shared model, at whatever the appropriate level of resolution.
Once mapped, the fractal model becomes the source for information discovery, data analytics, integration, rule writing, and much more.
Your enterprise fractal data model
If this appeals to you, all you need to do to get started is contact us. We’d be happy to help you!
Download the white paper (PDF)
Related reading: Ontologies and Taxonomies; Time Zones