They say good things come in threes and my journey to data-centricity started with three revelations.
The first was connected to a project I was working on for a university college with a problem that might sound familiar to some of you. The department I worked in was taking four months to clean, consolidate and reconcile our quarterly reports to the college executive. We simply did not have the resources to integrate incoming data from multiple applications into a coherent set of reports in a timely way.
The second came in the form of a lateral thinking challenge worthy of Edward de Bono: ‘How many different uses for a brick can you think of?’
The third revelation happened when I was on a consulting assignment at a multinational software company in Houston, Texas. As part of a content management initiative we were hired to work with their technical documentation team to install a large ECM application. What intrigued me the most, though, were the challenges the company experienced at the interface between the technology and the ‘multiple of multiples’ with respect to business language.
Revelation #1: Application Data Without the Application is Easy to Work With
The college where I had my first taste of data-centricity had the usual array of applications supporting its day-to-day operations. There were Student systems, HR systems, Finance systems, Facility systems, Faculty systems and even a separate Continuing Education System that replicated all those disciplines (with their own twists, of course) under one umbrella.
The department I worked in was responsible for generating executive quarterly reports for all activities on the academic side plus semi-annual faculty workload and annual graduation and financial performance reports. In the beginning we did this piece-meal and as IT resources became available. One day, we decided to write a set of specifications about what kind of data we needed; to what level of granularity; in what sequence; and, how frequently it should be extracted from various sources.
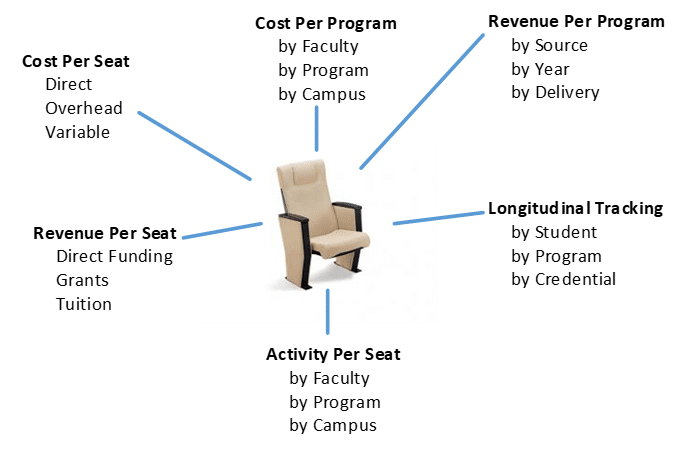
We called the process ‘data liquefication’ because once the data landed on our shared drive the only way we could tell what application it came from was by the file name. Of course, the contents and structure of the individual extracts were different, but they were completely pliable. Detached from the source application, we had complete freedom to do almost anything we wanted with it. And we did. The only data model we had to build (actually, we only ever thought about it once) was which “unit of production’ to use as the ‘center’ of our new reporting universe. To those of you working with education systems today, the answer will come as no surprise. We used ‘seat’.
Once that decision was taken, and we put feedback loops in to correct data quality at source, several interesting patterns emerged:
- The collections named Student, Faculty, Administrator and Support Staff were not as mutually exclusive as we originally thought. Several individuals occupied multiple roles in one semester.
- The Finance categories were set up to reflect the fact that some expenses applied to all Departments; some were unique to individual Departments; and, some were unique to Programs.
- Each application seemed to use a different code or name or structure to identify the same Person, Program or Facility.
From these patterns we were able to produce quarterly reports in half the time. We also introduced ‘what-if’ reporting for the first time, and since we used the granular concept of ‘seat’ as our unit of production we added Cost per Seat; Revenue per Seat; Overhead per Seat; Cross-Faculty Registration per Seat; and, Longitudinal Program Costs, Revenues, Graduation Rates and Employment Patterns to our mix of offerings as well.
Revelation #2: A Brick is Always a Brick. How it is Used in A Separate Question
When we separate what a thing “is” from how it is used, some interesting data patterns show up. I won’t take up much space in this article to enumerate them, but the same principle that can take ‘one thing’ like an individual brick and use it in multiple ways (paper weight, door stop, wheel chock, pendulum weight, etc.) puts the whole data classification thing in a new light.
The string “John Smith” can appear, for example, as the name of a doctor, a patient, a student, an administrator and/or an instructor. This is a similar pattern to the one that popped up at the university college. As it turns out that same string can be used as an entity name, an attribute, as metadata, reference data and a few other popular ‘sub-classes’ of data. They are not separate collections of ‘things’ as much as they are separate functions of the same thing.
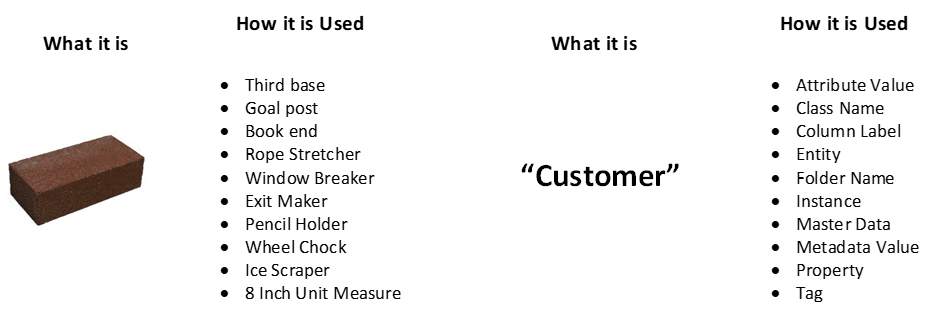
The implication for me was to classify ‘things’ first and foremost as what they refer to or in fact what they are. So, “John Smith” refers to an individual, and in my model surrounding data-centricity “is-a”(member of the set named) Person. On the other side of the equation, words like ‘Student’, ‘Patient’, and ‘Administrator’ for example are Roles. In my declarations, Student “is-a”(member of the set named) Role.
One of the things this allowed me to do was to create a very small (n = 19) number of mutually exclusive and exhaustive sets in any collection. This development also supported the creation of semantically interoperable interfaces and views into broadly related data stores.
Revelation #3: Shape and Semantics Must be Managed Separately and on Purpose
The theme of separation came up again while working on a technical publications project in Houston, Texas. Briefly, the objective was to render application user support topics into their smallest, reusable chunks and make it possible for technical writers to create document maps ranging from individual Help files in four different formats to full-blown, multi-chapter user guides and technical references. What really made the project challenging was what we came to call the ‘’multiple of multiples” problem. This turned out to be the exact opposite challenge of reuse in Revelation #1:
- Multiple customer platforms
- Multiple versions of customer platforms
- Multiple product families (Mainframe, Distributed and Hybrid)
- Multiple product platforms
- Multiple versions of product platforms
- Multiple versions of products (three prior, one current, and one work-in-progress)
- Multiple versions of content topics
- Multiple versions of content assemblies (guides, references, specification sheets, for example)
- Multiple customer locales (United States, Japan, France, Germany, China, etc.)
- Multiple customer language (English (two ‘flavours’), Japanese, German, Chinese, etc.)
The solution to this ‘factorial mess’ was not found in an existing technology (including the ECM software we were installing) but in fact came about by not only removing all architectural or technical considerations (as we did in Revelation #1), but asking what it means to say: “The content is the same” or “The content is different.”
In the process of comparing two components found in the ‘multiple of multiples’ list, we discovered three factors for consideration:
- The visual ‘shape’ of the components. ‘Stop’ and ‘stop’ look the same.
- The digital signatures of the components. We used MD5 Hash to do this.
- The semantics of the components. We used translators and/or a dictionary.
Figure 3 shows the matrix we used to demonstrate the tendency of each topic to be reused (or not) in one of the multiples.
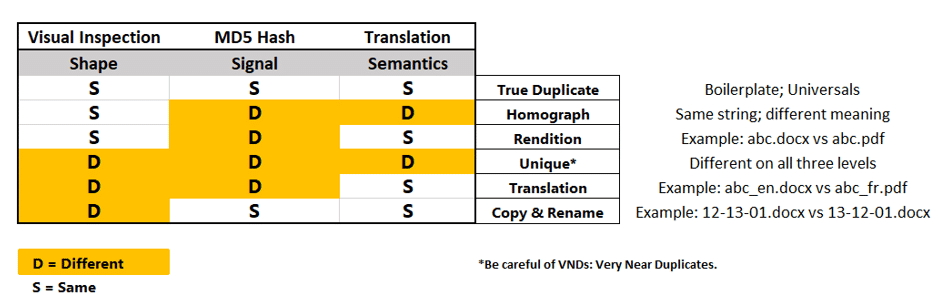
It turns out that content can vary as a result of time (a version), place (a locale with different requirements for the same feature, for example) people (different languages) and/or format (saving a .docx file as a pdf). In addition to changes in individual components, assemblies of components can have their own identities.
This last point is especially important. Some content was common to all products the company sold. Other content was variable along product lines, client platform, target market and audience. Finally, the last group of content elements were unique to a unique combination of parameters.
Take-Aways
Separating data from its controlling applications presents an opportunity to look at it in a new way. Removed from its physical and logical constraints, data-centricity begins to look a lot like the language of business. While the prospect of liberating data this way might horrify many application developers and data modelers out there, those of us trying to get the business closer to the information they need to accomplish their goals see the beginning of more naturally integrated way of doing that.
The Way Forward with Data-Centricity
Data-centricity in architecture is going to take a while to get used to. I hope this post has given readers a sense of what the levers to making it work might look like and how they could be put to good use.
Click here to read a free chapter of Dave McComb’s book, “The Data-Centric Revolution”