This article originally appeared at The Data-Centric Revolution: Best Practices and Schools of Ontology Design – TDAN.com. Subscribe to TDAN directly for this and other great content!
I was recently asked to present “Enterprise Ontology Design and Implementation Best Practices” to a group of motivated ontologists and wanna-be ontologists. I was flattered to be asked, but I really had to pause for a bit. First, I’m kind of jaded by the term “best practices.” Usually, it’s just a summary of what everyone already does. It’s often sort of a “corporate common sense.” Occasionally, there is some real insight in the observations, and even rarer, there are best practices without being mainstream practices. I wanted to shoot for that latter category.
As I reflected on a handful of best practices to present, it occurred to me that intelligent people may differ. We know this because on many of our projects, there are intelligent people and they often do differ. That got me to thinking: “Why do they differ?” What I came to was that there are really several different “schools of ontology design” within our profession. They are much like “schools of architectural design” or “schools of magic.” Each of those has their own tacit agreement as to what constitutes “best practice.”
Armed with that insight, I set out to identify the major schools of ontological design, and outline some of their main characteristics and consensus around “best practices.” The schools are (these are my made-up names, to the best of my knowledge none of them have planted a flag and named themselves — other than the last one):
- Philosophy School
- Vocabulary and Taxonomy School
- Relational School
- Object-Oriented School
- Standards School
- Linked Data School
- NLP/LLM School
- Data-Centric School
There are a few well known ontologies that are a hybrid of more than one of these schools. For instance, most of the OBO Life Sciences ontologies are a hybrid of the Philosophy and Taxonomy School, I think this will make more sense after we describe each school individually.
Philosophy School
The philosophy school aims to ensure that all modeled concepts adhere to strict rules of logic and conform to a small number of well vetted primitive concepts.
Exemplars
The Basic Formal Ontology (BFO), DOLCE and Cyc are the best-known exemplars of this school. Each has a set of philosophical primitives that all derived classes are meant to descend from.
How to Recognize
It’s pretty easy to spot an ontology that was developed by someone from the philosophy school. The top-level classes will be abstract philosophical terms such as “occurrent” and “continuant.”
Best Practices
All new classes should be based on the philosophical primitives. You can pretty much measure the adherence to the school by counting the number of classes that are not direct descendants of the 30-40 base classes.
Vocabulary and Taxonomy School
The vocabulary and taxonomy school tends to start with a glossary of terms from the domain and establish what they mean (vocabulary school) and how these terms are hierarchically related to each other (taxonomy school). The two schools are more alike than different.
The taxonomy school especially tends to be based on standards that were created before the Web Ontology Language (OWL). These taxonomies often model a domain as hierarchical structures without defining what a link in the hierarchy actually means. As a result, they often mix sub-component and sub-class hierarchies.
Exemplars
Many life sciences ontologies, such as SNOMED are primarily taxonomy ontologies, and only secondarily philosophy school ontologies. Also, the Suggested Upper Merged Ontology is primarily a vocabulary ontology, it was mostly derived from WordNet and one of its biggest strengths is its cross reference to 250,000 words and their many word senses.
How to Recognize
Vast numbers of classes. There are often tens of thousands or hundreds of thousands of classes in these ontologies.
Best Practices
For the vocabulary and taxonomy schools, completeness is the holy grail. A good ontology is one that contains as many of the terms from the domain as possible. The Simple Knowledge Organization System (SKOS) was designed for taxonomies. Thus, even though it is implemented in OWL, it is designed to add semantics to taxonomies that often are less rigorous, using generic predicates such as broaderThan and narrowerThan rather than more precise subclass or object properties such as “part of.” SKOS is a good tool for integrating taxonomies with ontologies.
Relational School
Most data modelers grew up with relational design, and when they design ontologies, they rely on ways of thinking that served them well in relational.
Exemplars
These are mostly internally created ontologies.
How to Recognize
Relational ontologists tend to be very rigorous about putting specific domains and ranges on all their properties. Properties are almost never reused. All properties will have inverses. Restrictions will be subclass axioms, and you will often see restrictions with “min 0” cardinality, which doesn’t mean anything to an inference engine, but to a relational ontologist it means “optional cardinality.” You will also see “max 1” and “exactly 1” restrictions which almost never imply what the modeler thought, and as a result, it is rare for relational modelers to run a reasoner (they don’t like the implications).
Best Practices
For relational ontologist best practices are to make ontologies that are as similar to existing relational structures as possible. Often, the model is a direct map from an existing relational system.
Modelers in the relational school (as well as the object-oriented school coming up next) tend to bring the “Closed World Assumption” (CWA) with them from their previous experience. CWA takes a mostly implicit attitude that the information in the system is a complete representation of the world. The “Open World Assumption” (OWA) takes the opposite starting point: that the data in the system is a subset of all knowable information on the subject.
CWA was and is more appropriate in narrow scope, bounded applications. When we query your employee master file looking for “Dave McComb” and don’t get a hit, we reasonably assume that he is not an employee of your enterprise. When TSA queries their system and doesn’t get a hit, they don’t assume that he is not a terrorist. They still use the X-ray and metal detectors. This is because they believe that their information is incomplete. They are open worlders. More and more of our systems combine internal and external data in ways that are more likely to be incomplete.
There are techniques for closing the open world, but the relational school tends not to use them because they assume their world is already closed.
Object-Oriented School
Like the relational school, the object-oriented school comes from designers who grew up with object-oriented modeling.
Exemplars
Again, a lot of object-oriented (OO) ontologies are internal client projects, but a few public ones of note include eCl@ss and Schema.org. eCl@ss is a standard for describing electrical products. It has been converted into an ontology. The ontology version has 60,000 classes, which combine taxonomic and OO style modeling. Schema.org is an ontology for tagging web sites that Google promotes to normalize SEO. It started life fairly elegant. It now has 1300 classes, many of which are taxonomic distinctions, rather than real classes.
How to Recognize
One giveaway for the object-oriented school is designing in SHACL. SHACL is a semantic constraint language, which is quite useful as a guard for updates to a triple store. Because SHACL is less concerned with meaning and more concerned with structure, many object-oriented ontologists prefer it to OWL for defining their classes.
Even those who design in OWL have some characteristic tells. OO ontologists tend to use subclassing far more than relational ontologists. They tend to declare which class is a subclass of another, rather than allowing the inference engine to infer subsumption. There is also a tendency to believe that the superclass will constrain subclass membership.
Best Practices
OO ontologies tend to co-exist with Graph QL and focus on json output. This is because the consuming applications are object oriented, and this style ontology and architecture have less impedance mismatch with the consuming applications. The level of detail tends to mirror the kind of detail you find in an application system. Best practices for an OO ontology would never consider the tens of thousands or hundreds of thousands of classes in a taxonomy ontology, nor would they go for the minimalist view of the philosophy or data-centric schools. They tend to make all distinctions at the class level.
Standards School
This is a Janus school, with two faces, one facing up and one facing down. The one facing down is concerned with building ontologies that others can (indeed should) reuse. The one facing up is the enterprise ontologies that import the standard ontologies in order to conform.
Exemplars
Many of the most popular ontology standards are produced and promoted by the W3C. These include DCAT (Data Catalog Vocabulary), the Ontology for Media Resources, Prov-O (an ontology of provenance), Time Ontology, and Dublin Core (an ontology for metadata, particular around library science).
How to Recognize
For the down facing standards ontology, it’s pretty easy. They are endorsed by some standards body. Most common are W3C, OMG and Oasis. ISO has been a bit late to this party, but we expect to see some soon. (Everyone uses the ISO country and currency codes, and yet there is no ISO ontology of countries or currencies.) There are also many domain-specific standard ontologies that are remakes of their previous message model standards, such as FHIR from HL7 in healthcare and ACORD in insurance.
The upward facing standards ontologies can be spotted by their importing a number of standard ontologies each meant to address an aspect of the problem at hand.
Best Practices
Best practice for downward facing standards ontologies is to be modular, fairly small, complete and standalone. Unfortunately, this best practice tends to result in modular ontologies that redefine (often inconsistently) shared concepts.
Best practice for upward facing standards ontologies is to rely as much as possible on ontologies defined elsewhere. This usually starts off by importing many ontologies and ends up with a number of bridges to the standards when it’s discovered that they are incompatible.
Linked Open Data School
The linked open data school promotes the idea of sharing identifiers across enterprises. Linked data is very focused on instance (individual or ABox) data, and only secondarily on classes.
Exemplars
The poster child for LOD is DBPedia, the LOD knowledge graph derived from the Wikipedia information boxes. It also includes the direct derivatives such as WikiData and the entire Linked Open Data Cloud.
I would put the Global Legal Entity Identifier Foundation (GLEIF) in this school as their primary focus is sharing between enterprises and there are more focused on the ABox (the instances).
How to Recognize
Linked open data ontologies are recognizable by their instances, often millions and in many cases billions of instances. The ontologies (TBox) is often very naïve, as they are often derived directly from informal classifications made by text editors in Wikipedia and its kin.
You will see many adhoc classes raised to the status of a formal class in LOD ontologies. I just notice the classes dbo:YearInSpaceFlight and yago:PsychologicalFeature100231001.
Best Practices
The first best practice (recognized more in the breach) is to rely on other organizations IRIs. This is often clumsy because historically, each organization invented identifiers for things in the world (their employees and vendors for instance) and they tend to build their IRIs around these well-known (at least locally) identifiers.
A second best practice is entity resolution and “owl:sameAs.” Entity resolution can determine if two IRIs represent the same real-world object. Once recognized, one of the organizations can choose to adopt the others IRI (previous paragraph best practice) or continue to use their own, but recognize the identity through owl:sameAs (which is mostly motivated by the following best practice).
LOD creates the opportunity for IRI resolution at the instance level. Put the DBPedia IRI for a famous person in your browser address bar and you will be redirected to DBPedia resolution page for that individual, showing all that DBPedia knows about them. For security reasons, most enterprises don’t yet do this. Because of this, another best practice is to only create triples with subjects whose domain name you control. Anything you state about a IRI in someone else’s name space will not be available for resolution by the organization that minted the subject URI.
NLP/LLM School
There is a school of ontology design that says turn ontology design over to the machines. It’s too hard anyway.
Exemplars
Most of these are also internal projects. About every two to three years, we see another startup with the premise that ontologies can be built by machines. For most of history, these were cleverly tailored NLP systems. The original works in this area took large teams of computational linguists to master.
This year (2023), they are all LLMs. You can ask ChatGPT to build an ontology for [fill in the blank] industry, and it will come up with something surprisingly credible looking.
How to Recognize
For LLMs, the first giveaway are hallucinations. These are hard to spot and require deep domain and ontology experience to pick out. The second clue is humans with six fingers (just kidding). There aren’t many publicly available LLM generated ontologies (or if there are they are so good we haven’t detected that they were machine generated).
Best Practices
Get a controlled set of documents that represent the domain you wish to model. This is better than relying on what ChatGPT learned by reading the internet.
And have a human in the loop. This is an approach that shows significant promise and several researchers have already created prototypes that utilize this approach. Consider that the NLP / LLM created artifacts are primarily speed reading or intelligent assistants for the ontologist.
In the broader adoption of LLMs, there is a lot of energy going into ways to use knowledge graphs as “guard rails” against some of LLMs excesses, and the value of keeping a human in the loop. Our immediate concern there are advocates of letting generative AI design ontologies, and as such it becomes a school of its own.
Data-Centric School
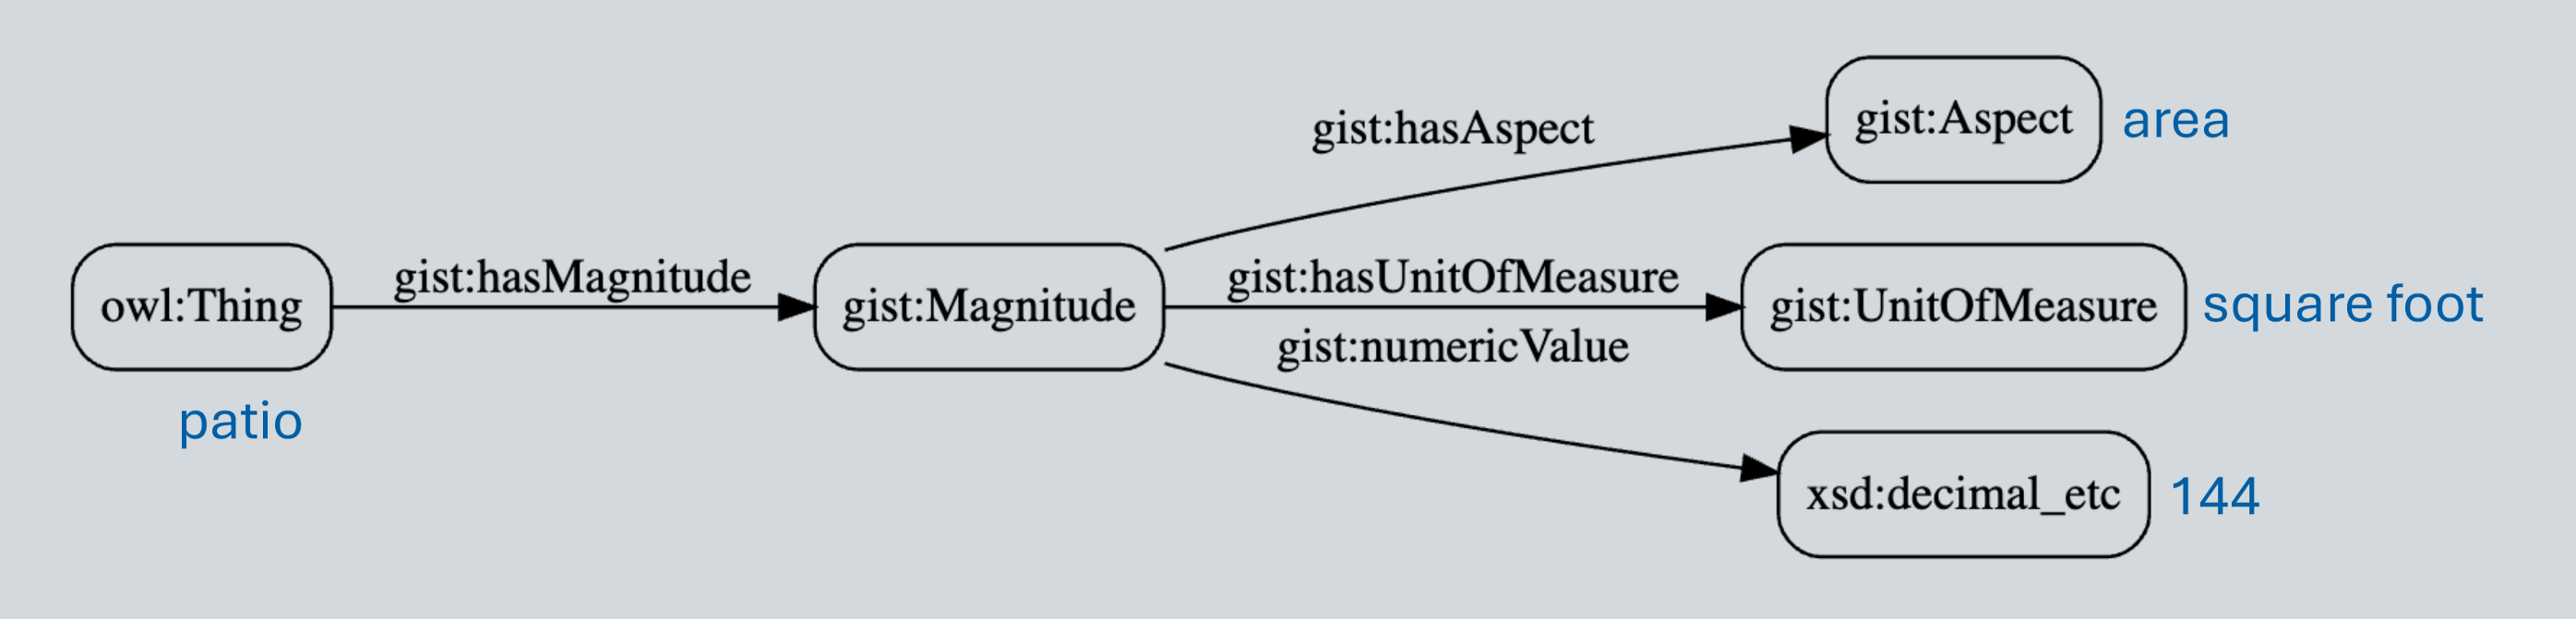
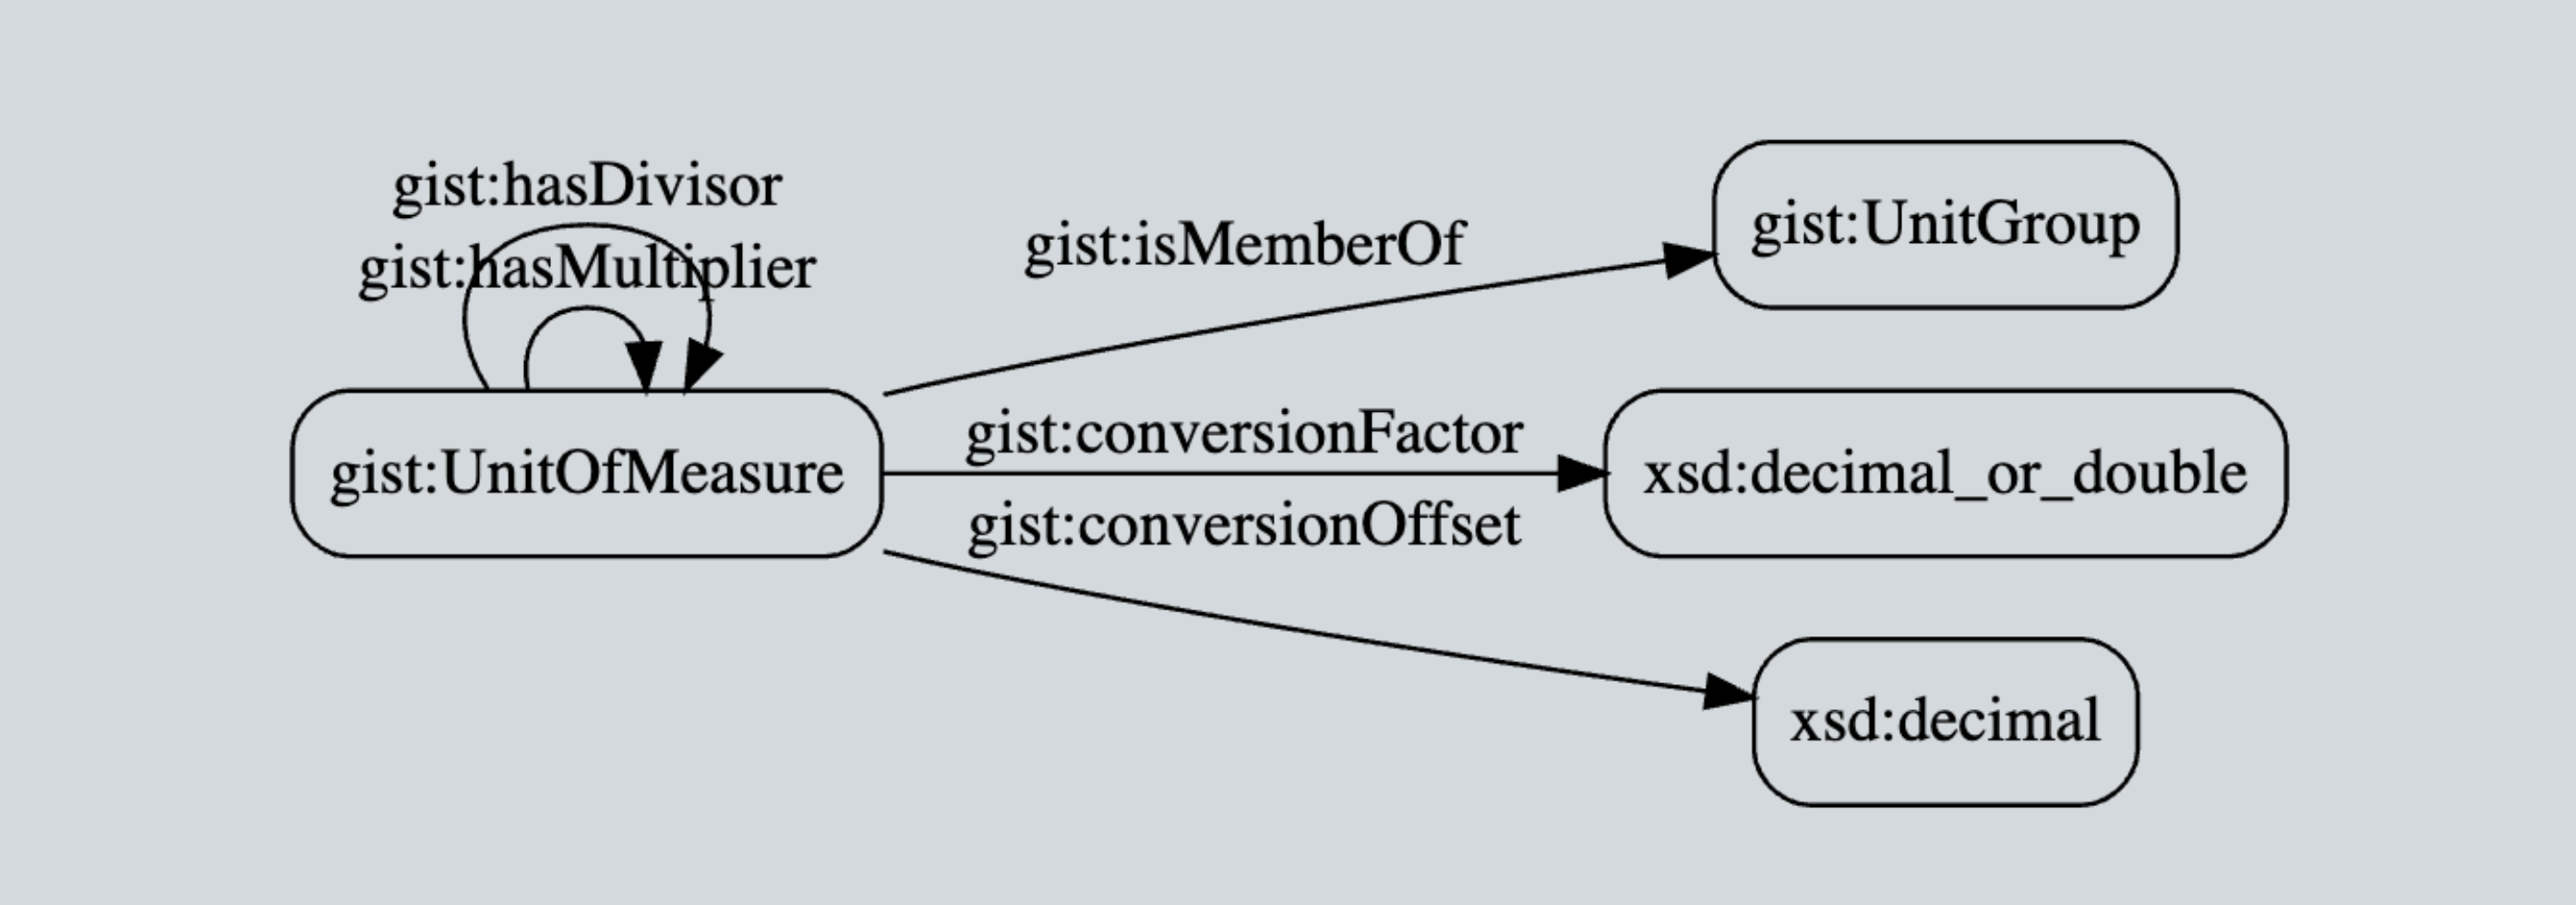
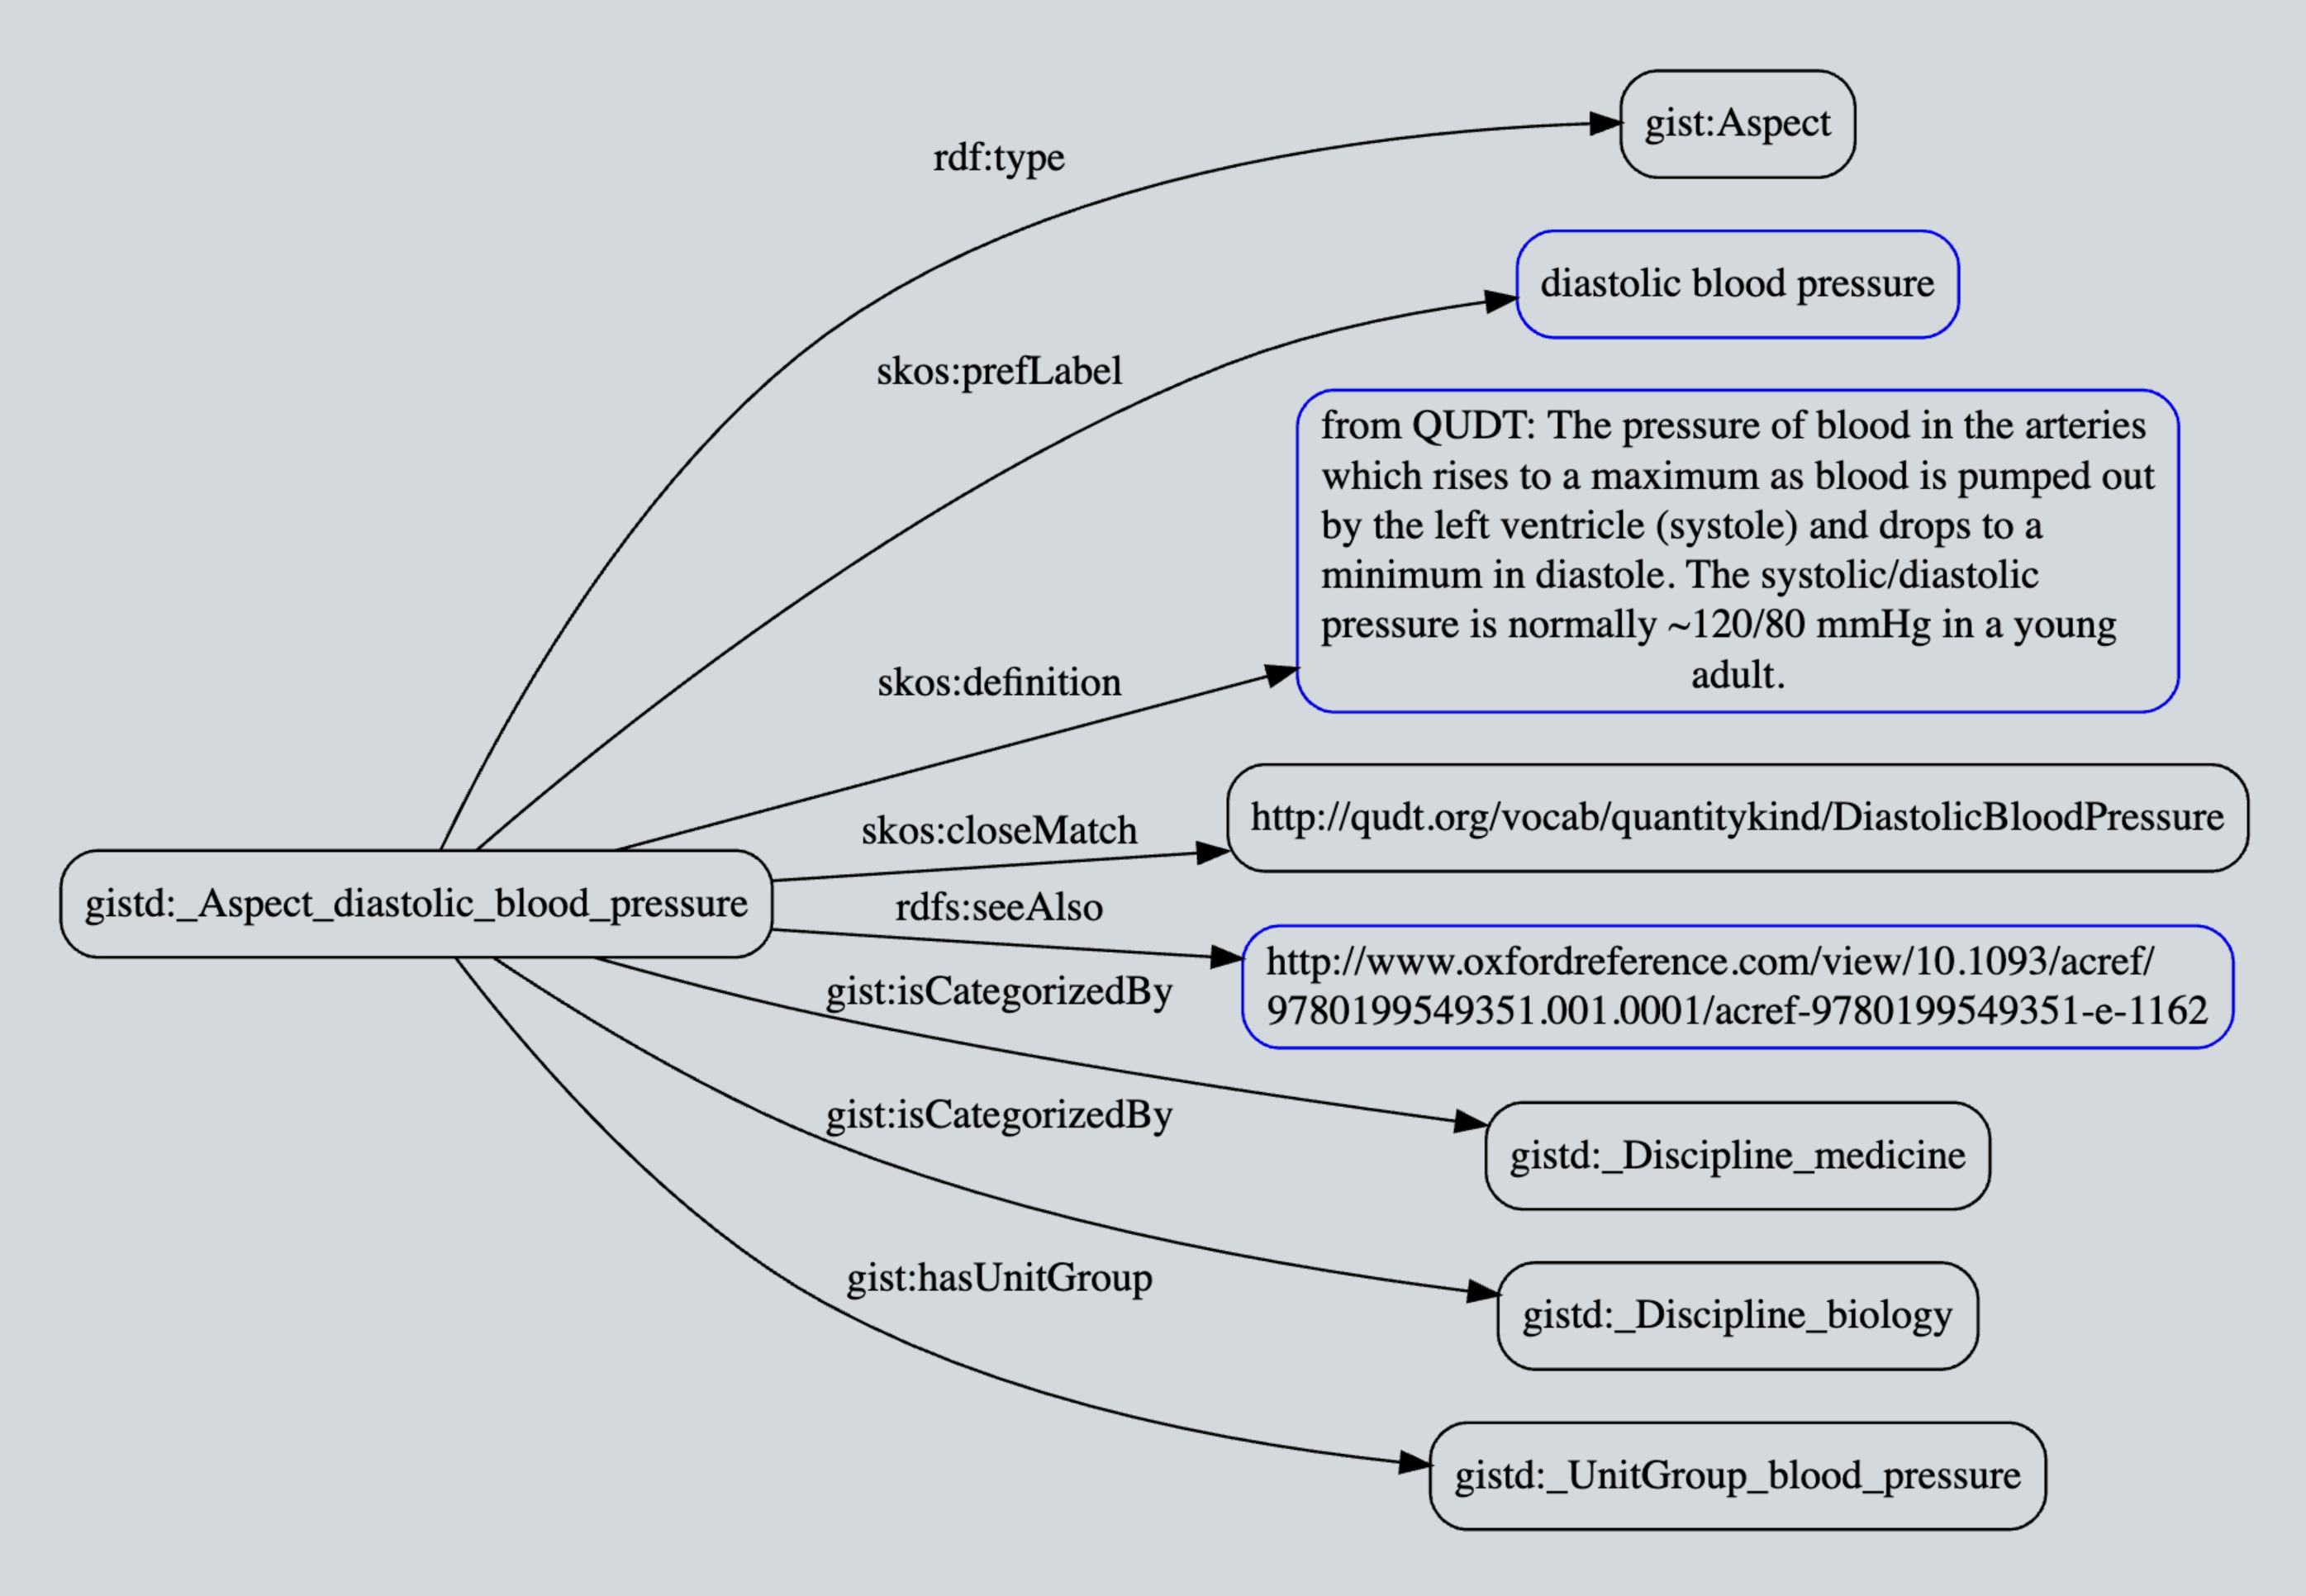
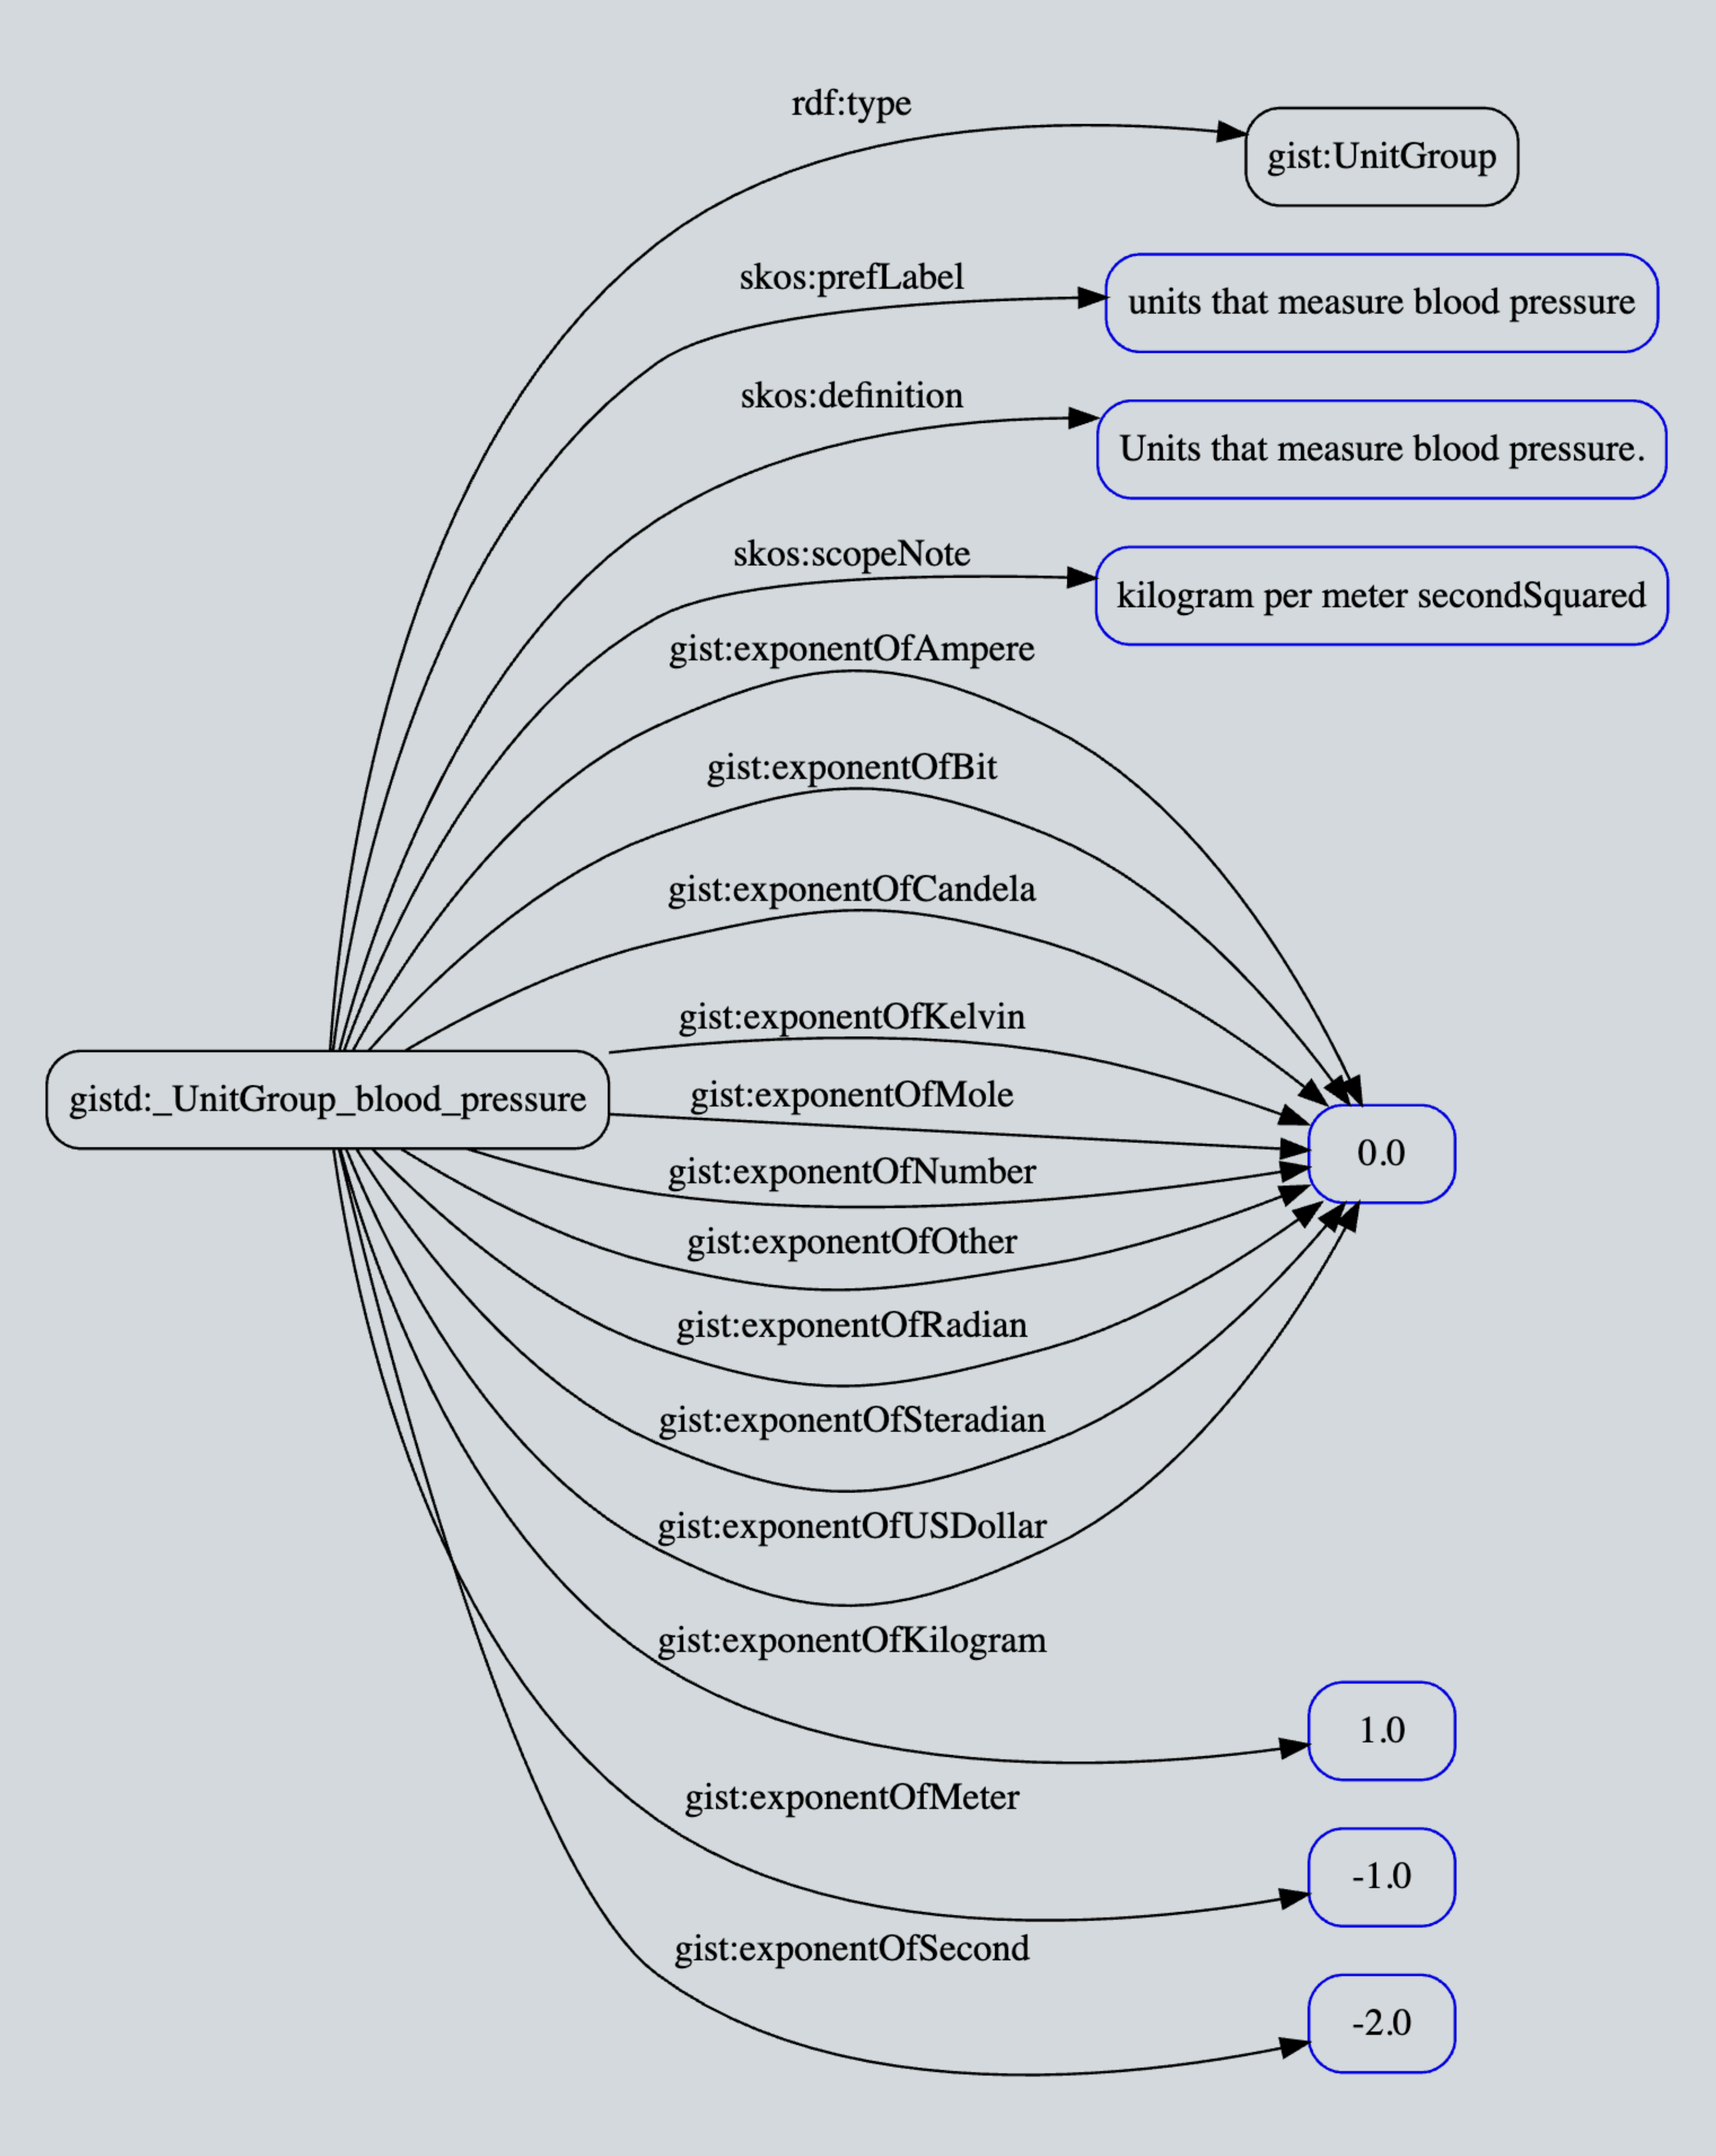
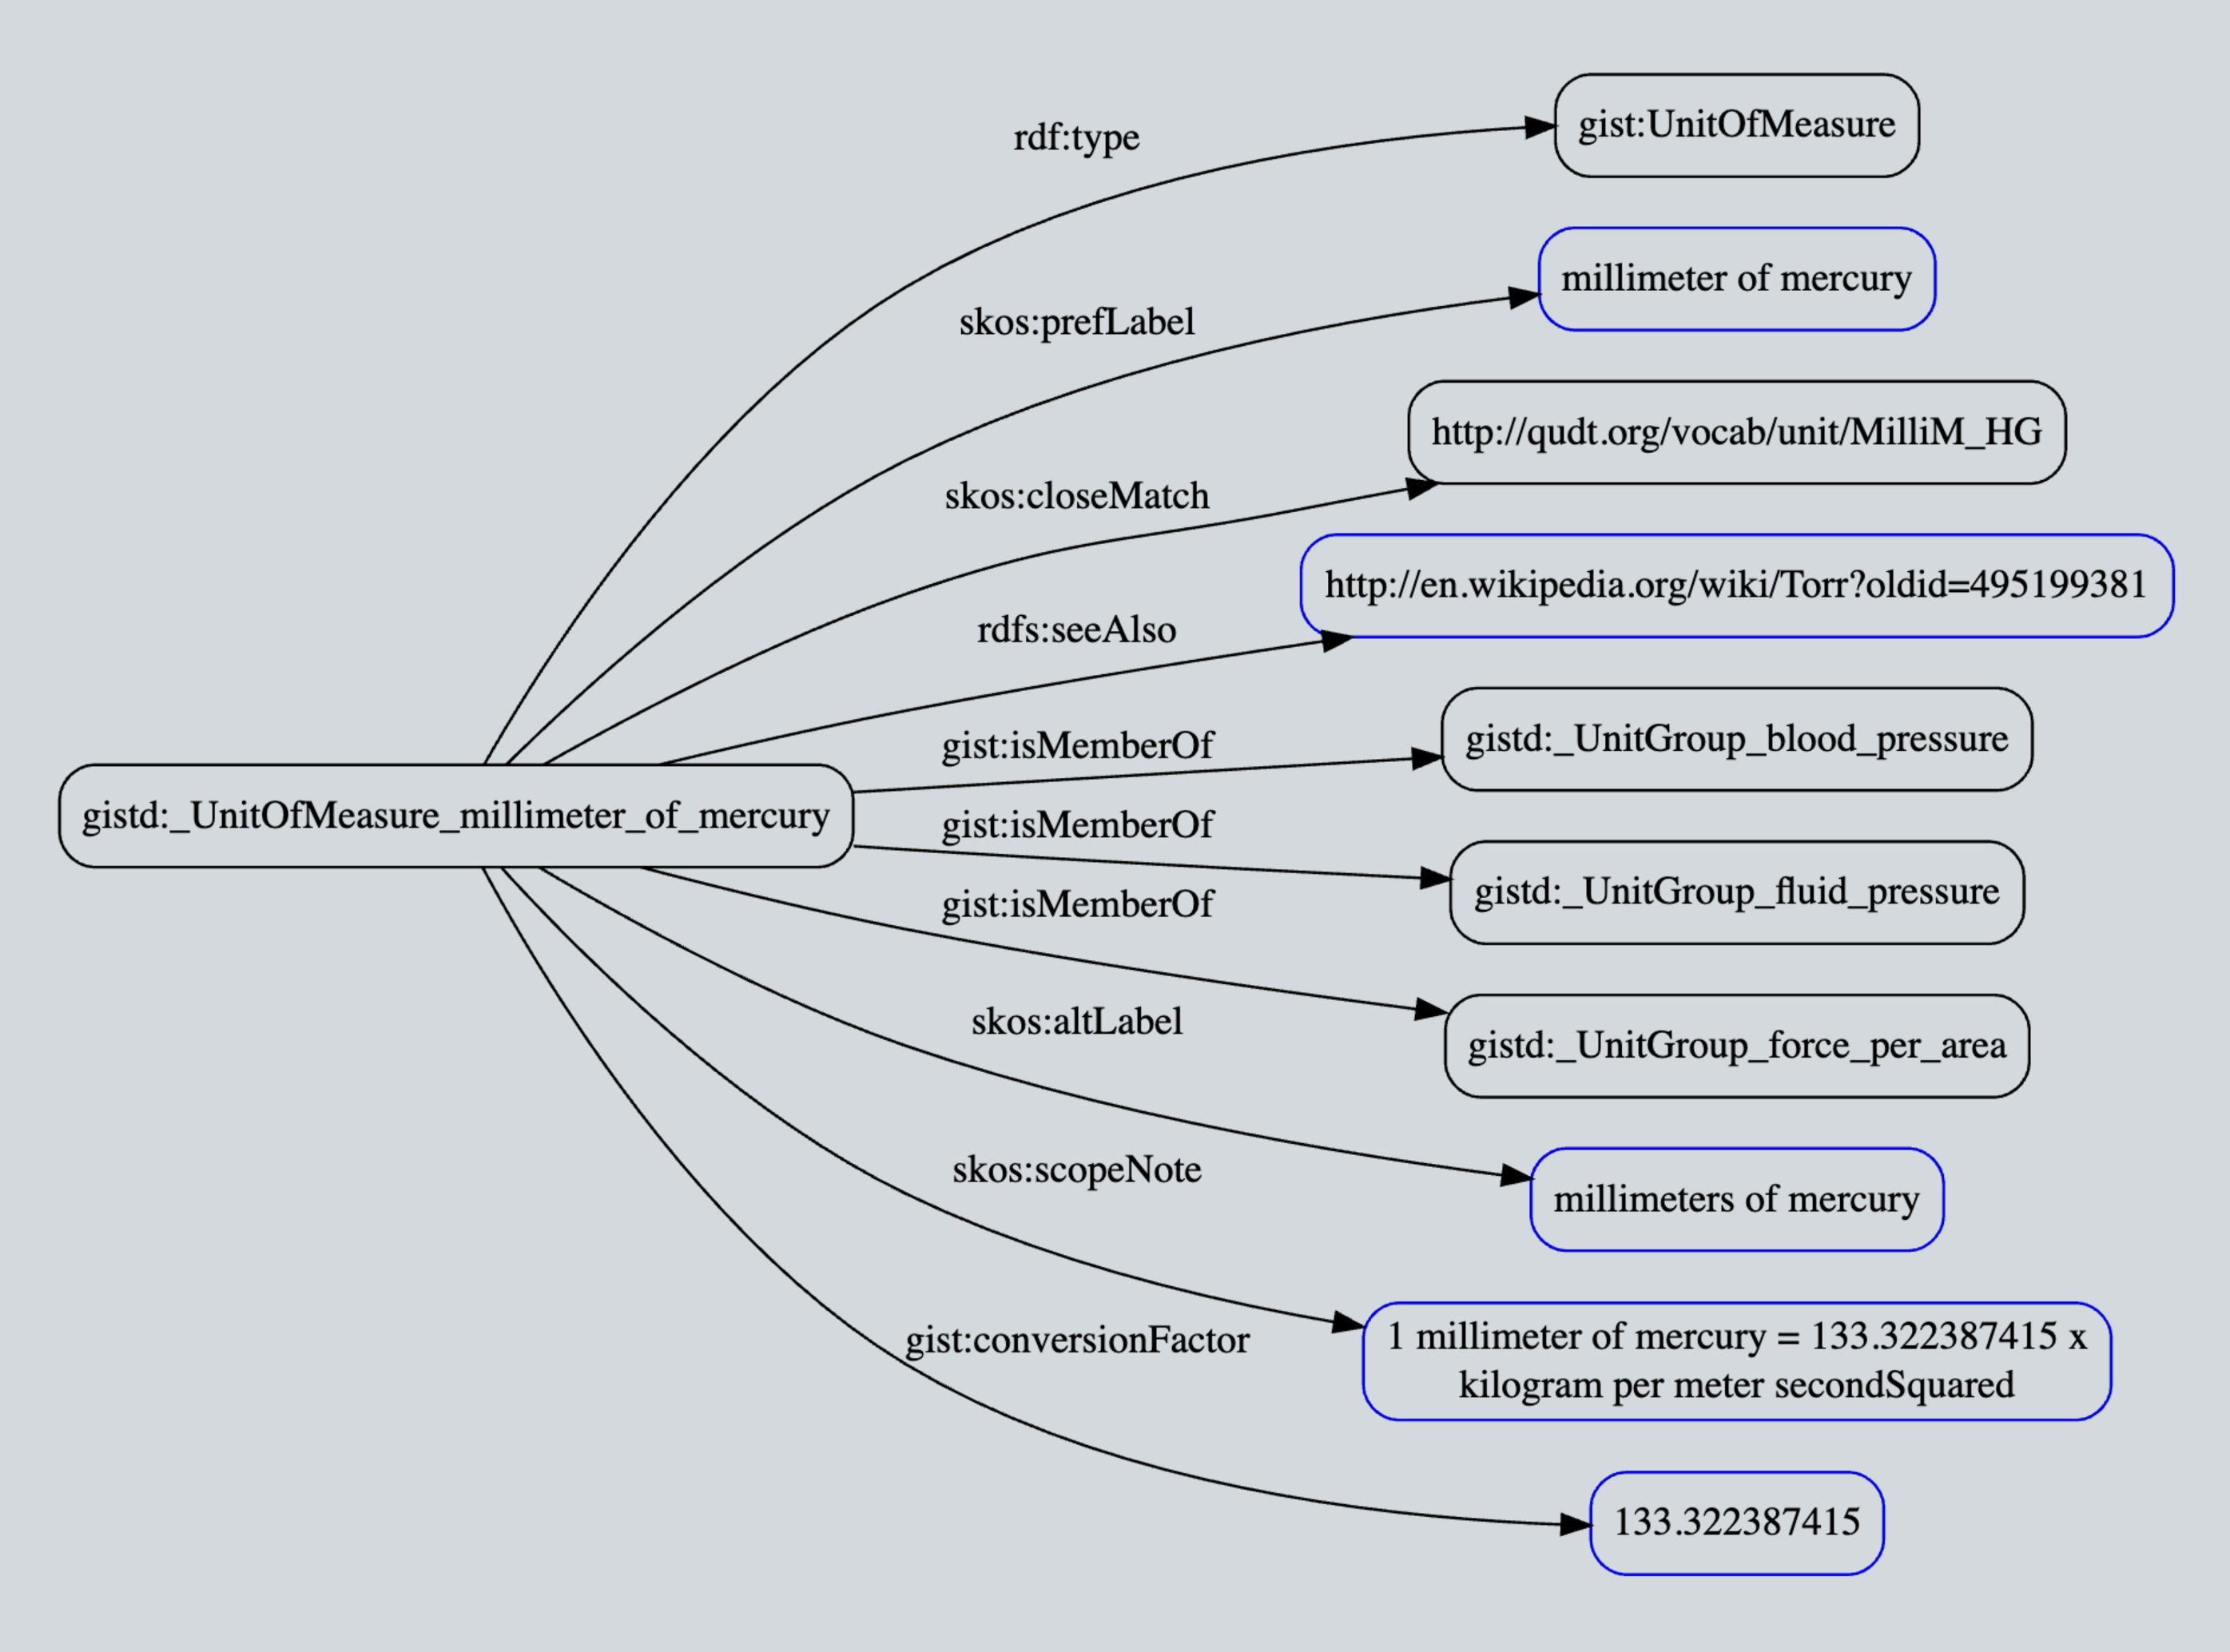
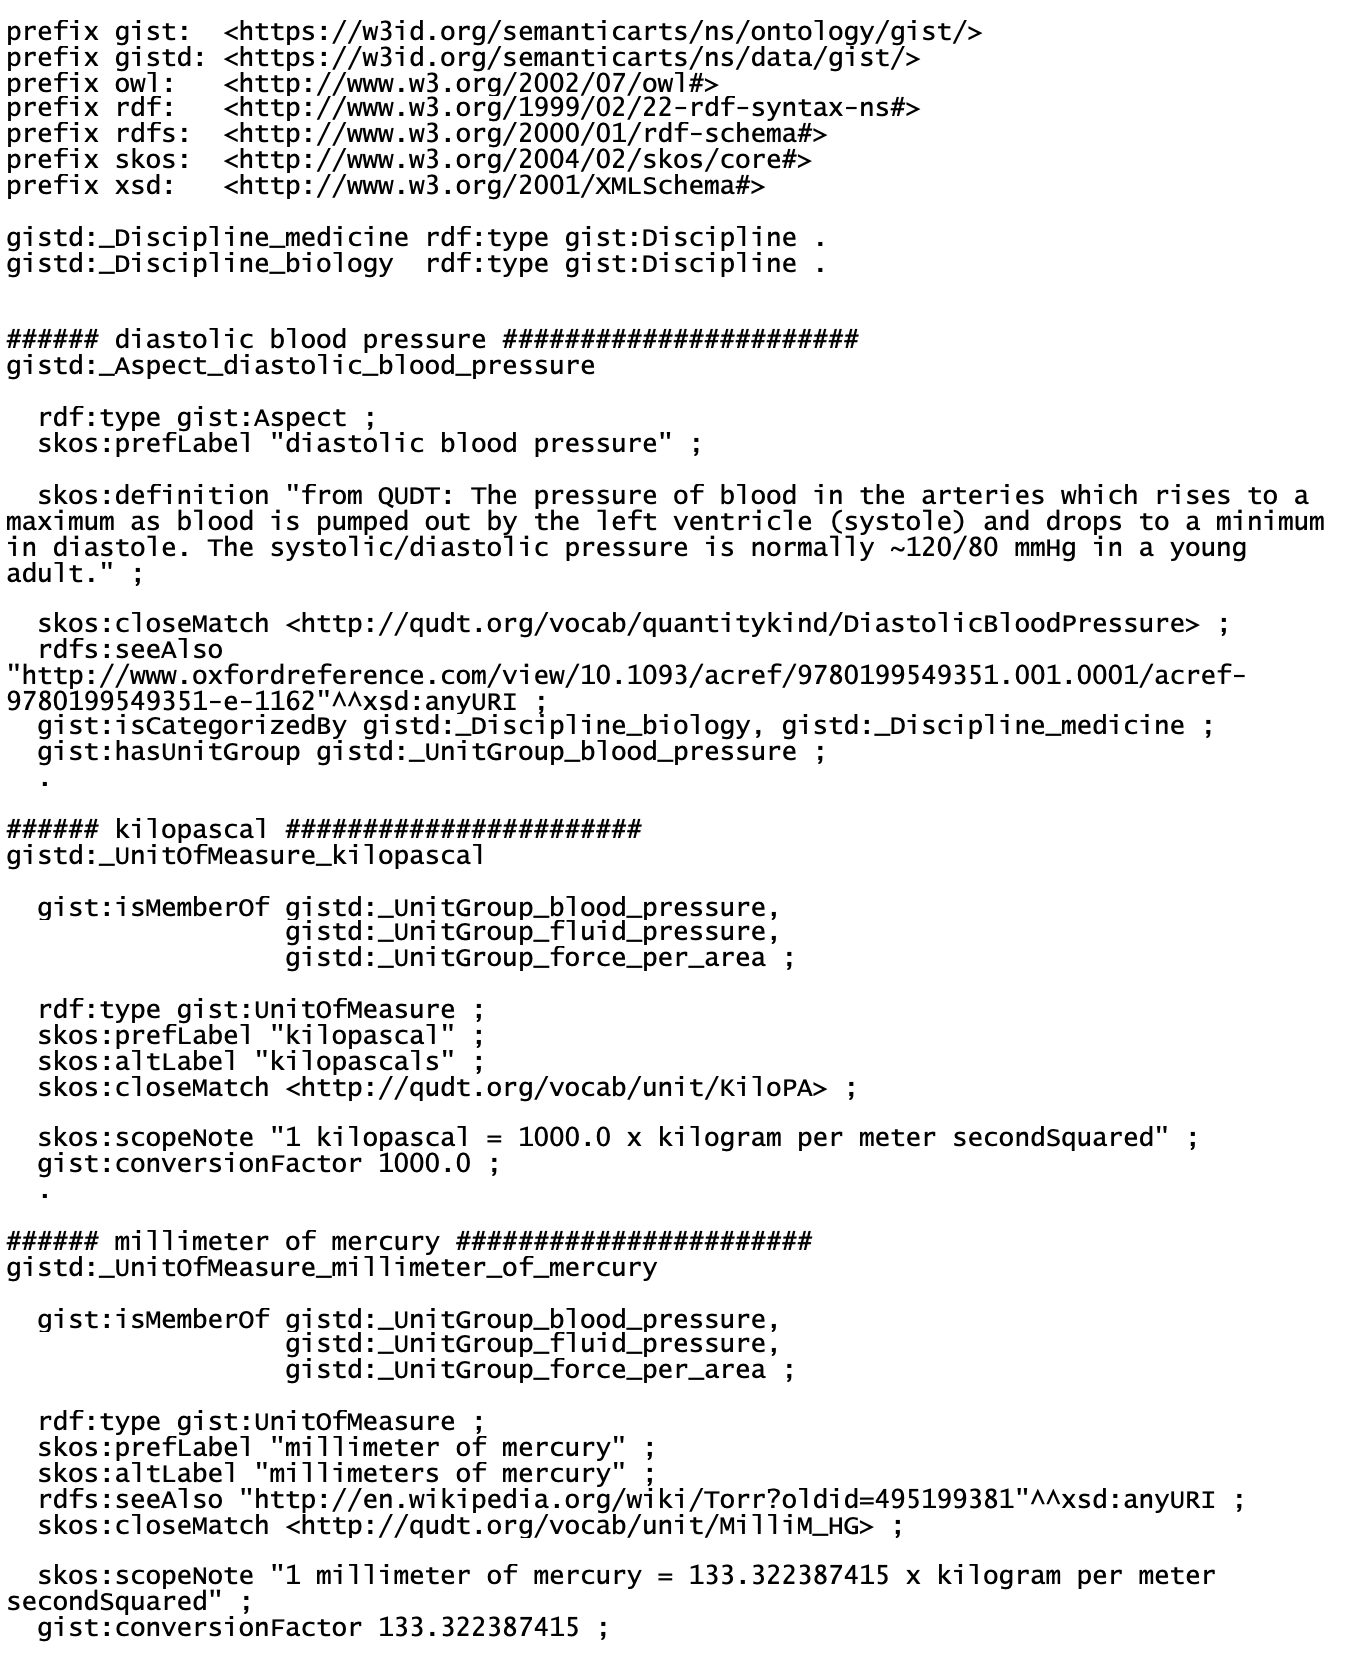
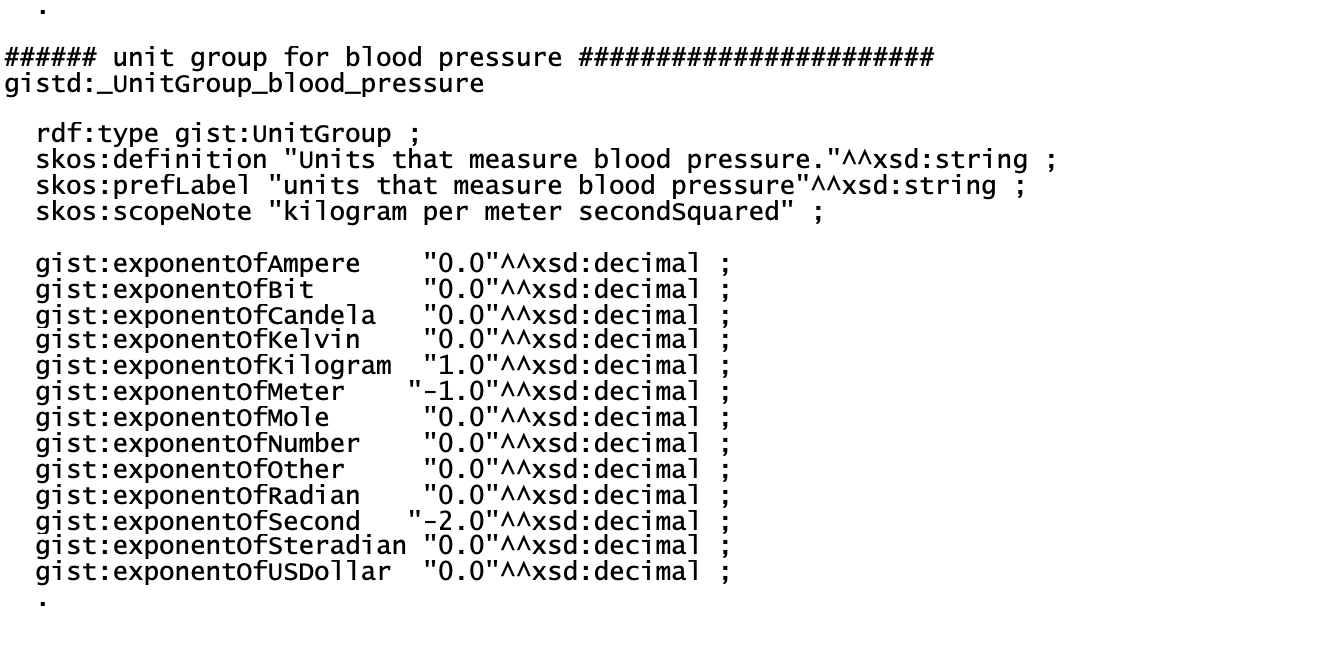
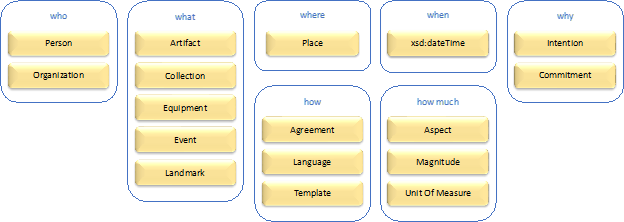
The data-centric school of ontology design, as promoted by Semantic Arts, focuses on ontologies that can be populated and implemented. In building architecture, they often say “It’s not architecture until it’s built.” The data-centric school says, “It’s not an ontology until it has been populated (with instance level, real world data, not just taxonomic tags).” The feedback loop of loading and querying the data is what validates the model.
Exemplars
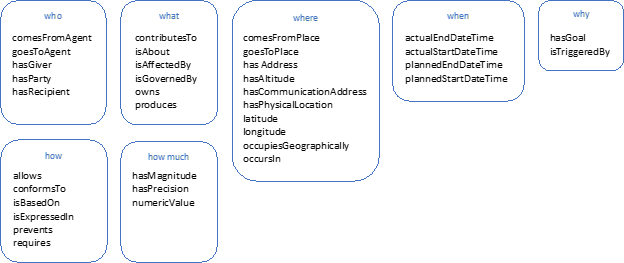
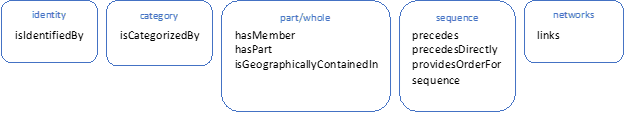
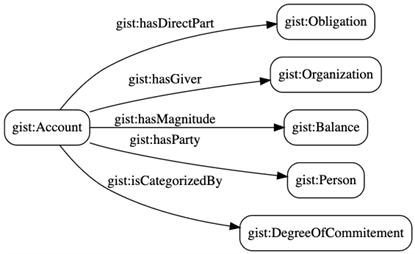
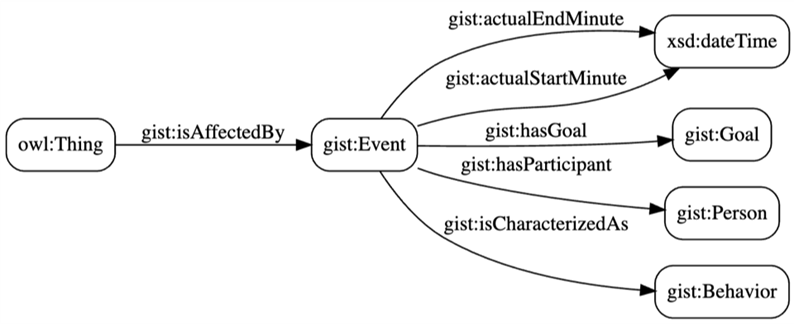
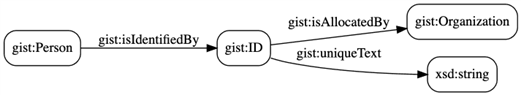
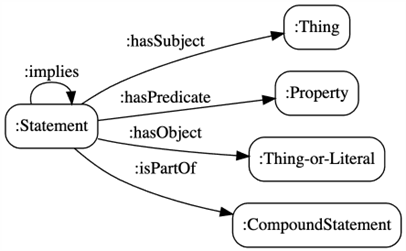
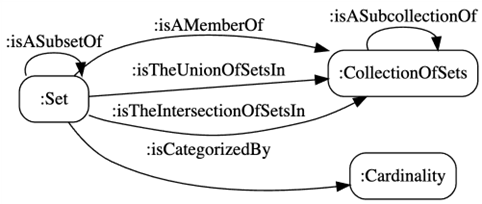
Gist, an open-source owl ontology, is the exemplar data-centric ontology. SchemaApp, Morgan Stanley’s compliance graph, Broadridge’s Data Fabric, Procter & Gamble’s Material Safety graph, Schneider-Electric’s product catalog graph, Standard & Poor’s commodity graph, Sallie Mae’s Service Oriented Architecture and dozens of small firms’ enterprise ontologies are based on gist.
How to Recognize
Importing gist is a dead giveaway. Other telltale signs include a modest number of classes (less than 500 for almost all enterprises) and eschewing inverse and transitive properties (the overhead for these features in a large knowledge graph far outweigh their expressive power). Another giveaway is delegating taxonomic distinctions to be instances of subclasses of gist:Category rather than being classes in their own right.
Best Practices
One best practice is to have non primitive classes have “equivalent class” restrictions that define class membership and are used to infer the class hierarchy. Another best practice is to have domains and ranges at very high levels of abstraction (and often missing completely) in order to promote property reuse and reduce future refactoring.
Another best practice is to load a knowledge graph with data from the domain of discourse to prove that the model is appropriate and at the requisite level of detail.
Summary
One of the difficulties in getting wider spread adoption of ontologies and knowledge graphs is that if you recruit and/or assemble a group of ontologists, there is a very good chance you will have members from multiple of the above-described schools. There is a good chance they will have conflicting goals, and even a different definition of what “good” is. Often, they will not even realize that their difference of opinion is due to their being members of a different tribe.
There isn’t one of these schools that is better than any of the others for all purposes. They each grew up solving different problems and emphasizing different aspects of the problem.
When you look at existing ontologies, especially those that were created by communities, you’ll often find that many are an accidental hybrid of the above schools. This is caused by different members coming to the project from different schools and applying their own best practices to the design project.
Rather than try to pick which school is “best,” you should consider what the objectives of your ontology project are and use that to determine which school is better matched. Select ontologists and other team members who are willing to work to the style of that school. Only then is it appropriate to consider “best practices.”
Acknowledgement
I want to acknowledge Michael Debellis for several pages of input on an early draft of this paper. The bits that didn’t make it into this paper may surface in a subsequent paper.