Morgan Stanley: Data-Centric Journey
Morgan Stanley has been on the semantic/ data-centric journey with us for about 6 years. Their approach is the adoption of an RDF graph and the development of a semantic knowledge base to help answer domain-specific questions, formulate classification recommendations and deliver quality search to their internal users. Their primary objective is to enable the firm to retrieve, retain and protect information (i.e., where the information resides, how long it must be maintained and what controls apply to it).
The knowledge graph is being developed by the Information Management team under the direction of Nic Seyot (Managing Director and Head of Data & Analytics for Non-Financial Risk). Nic is responsible for the development of the firm-wide ontology for trading surveillance, compliance, global financial crime and operational risk. Nic’s team is also helping other departments across the firm discover and embrace semantic data modeling for their own use cases.
Morgan Stanley has tens of thousands of discrete repositories of information. There are many different groups with specialized knowledge about the primary objectives as well as many technical environments to deal with. Their motivating principle is to understand the conceptual meaning of the information across these various departments and environments so that they can answer compliance and risk questions.
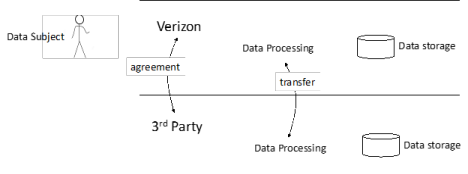
A good example is a query from a user about the location of sensitive information (with many conflicting classifications) and whether they are allowed to share it outside of the firm. The answer to this type of question involves knowledge of business continuity, disaster recovery, emergency planning and many other areas of control. Their approach is to leverage semantic modeling, ontologies and knowledge graph to be able to comprehensively answer that question.
To build the knowledge graph around these information repositories, they hired Semantic Arts to create a core ontology around issues that are relevant to the entire firm – including personnel, geography, legal entities, records management, organization and a number of firm-wide taxonomies. Morgan Stanley is committed to open standards and W3C principles which they have combined with their internal standards around quality governance. They created a Semantic Modeling and Ontology Consortium to help govern and maintain that core ontology. Many divisions within the firm have joined the advisory board for the consortium and it is viewed as an excellent way of facilitating cooperation between divisions.
The adoption-based principle has been a success. They have standardized ETL and virtualization to get information structured and into their knowledge graph. The key use case is enterprise search to give departments the ability to search for their content by leveraging the tags, lists, categories and taxonomies they use as facets for content search. One of the key benefits is an understanding of the network of concepts and terms as well as how they relate to one another within their organization.
Semantic Arts ontologists helped engineer the network of concepts that are included into their semantic thesaurus as well as how they interconnect within the firm. They started out with over 6,500 policies and procedures as a curated corpus of knowledge of the firm. They used natural language to extract the complexity of relationships out of their combined taxonomies (over half a million concepts). We worked with them to demonstrate the power of conceptual simplification. We helped them transform these complex relationships into broader, narrower and related properties which enable the users to ask business questions in their own context (and acronyms) to enhance the quality of search without manual curation. Our efforts helped reduce the noise, merge concepts with similar meaning and identify critical topics to support complex queries from users.
Contact Us:
Overcome integration debt with proven semantic solutions.
Contact Semantic Arts, the experts in data-centric transformation, today!
Address: Semantic Arts, Inc.
123 N College Avenue Suite 218
Fort Collins, CO 80524
Email: [email protected]
Phone: (970) 490-2224