
There was a time when RDF and triplestores were only seen through the lens of massive data integration. Teams went to great extremes to show how many gazillion triples per second their latest development could ingest, and large integrations did likewise with enormous datasets. This was entirely appropriate and resulted in the outstanding engineering achievements that we now rely on daily. However, for this post I would like to look at the other end of the spectrum – the ‘small is beautiful’ end – and I will relate a story about networking tiny, community-based air quality sensors, a Raspberry Pi, low-code orchestration software, and an in-memory triplestore. This is perhaps one of a few blog posts, we’ll have to see. It starts with looking at using graphs at the edge, rather than the behemoth at the centre where this blog started.
The proposition was to see if the sensor data can be brought together through the Node Red low-code/no-code framework to feed the data into RDFox, an in-memory triplestore and then data summaries periodically pushed to a central, larger triplestore. Now, I’m not saying that this is the only way to do this – I’m sure many readers will have their views on how it can be done, but I wanted to see if a minimalist approach was feasible. I also wanted to see if it was rapid and reproducible. Key to developing a broad network of any IoT is the need to scale. What is also needed though is some sort of ‘semantic gateway’ where meaning can be added to what might otherwise be a very terse MQTT or similar feed.
So, let’s have a look for a sensor network to use. I found a great source of data from the Aberdeen Air Quality network (see https://www.airaberdeen.org/ ) led by Ian Watt as part of the Aberdeen ODI and Code The City activities. They are contributing to the global Sensor.Community (formerly Luftdaten) network of air quality sensors. Ian and his associated community have built a handful of small sensors that detect particulate matter in air, the PM10 and PM2.5 categories of particles. These are pollutants that lead to various lung conditions and are generated in exhaust from vehicles, and other combustion and abrasion actions that are common in city environments. Details of how to construct the sensors is given in https://wiki.57north.org.uk/doku.php/projects/air_quality_monitor and https://sensor.community/en/sensors/ . The sensors are all connected to the Sensor.Community (https://sensor.community/en/) project from which their individual JSON data feeds can be polled by a REST call over HTTP(S). These sensors cost about 50 Euros to build, in stark contrast to the tens of thousands of Euros that would be required to provide the large government air quality sensors that are the traditional and official sources of air quality information (http://www.scottishairquality.scot/latest/?la=aberdeen-city) . And yet, despite the cheapness of the device, many studies including those of Prof Rod Jones and colleagues in Cambridge University (https://www.ch.cam.ac.uk/group/atm/person/rlj1001) have found that a wide network of cheap sensors can provide reliable and useful data for air quality monitoring.
So, now that we’ve mentioned Cambridge University we can go on to mention Oxford, and in particular RDFox, the in-memory triplestore and semantic reasoner from Oxford Semantic Technologies (https://www.oxfordsemantic.tech/). In this initial work, we are not using the Datalog reasoning or rapid materialization that this triplestore affords, but instead we stick with the simple addition of triples, and extraction of hourly digests of the data. In fact, RDFox is capable of far more beyond the scope of today’s exercise and much of the process here could be streamlined and handled more elegantly. However, I chose not to make use of these attributes for the sake of showing the simplicity of Node-RED. You might expect this to require a large server, but you’d be wrong - I managed all of it on a tiny Raspberry Pi 4 running the ARM version of Ubuntu. Thanks to Peter Crocker and Diana Marks of Oxford Semantic Technologies for help with the ARM version.
Next up is the glue, pipelining the raw JSON data from the individual sensors into a semantic gateway in which the data will be transformed into RDF triples using the Semantic Arts ‘gist’ ontology (https://www.semanticarts.com/gist/ and https://github.com/semanticarts/gist/releases). I chose to do this using a low-code/no-code solution called Node RED (https://nodered.org/). This framework uses a GUI with pipeline components drawn onto a canvas and linked together by arrows (how very RDF). As the website says, “Node-RED is a programming tool for wiring together hardware devices, APIs and online services in new and interesting ways. It provides a browser-based editor that makes it easy to wire together flows using the wide range of nodes in the palette that can be deployed to its runtime in a single-click.“ This is exactly what we need for this experiment in minimalism. Node-RED provides a wealth of functional modules for HTTP and MQTT calls, templating, decisions, debugging, and so forth. It make it easier to pipeline together a suite of processes to acquire data, transform it, and then push it on to somewhere else than traditional coding. And this ‘somewhere else’ was both the local RPi running RDFox and the Node-RED service, and also a remote instance of RDFox, here operating with disk-based persistence.
Following the threading together of a sequence of API calls to the air sensor endpoints with some templating to an RDF model based on ‘gist’ and uploading to RDFox over HTTP (Figs 1 & 2), the RDFox triplestore can then be queried using a SPARQL CONSTRUCT query to extract a summary of the readings for each sensor on an hourly basis. This summary included the minimum and maximum readings within the hour period for both particle categories (PM10 and PM2.5), for each of the sensors, together with the numbers of readings that were available within that hour period. This was then uploaded to the remote RDFox instance, (Figs 3 & 4) and that store becomes the source of the hourly information for dashboards and the like (Fig 5). Clearly, this approach can be scaled widely by simply adding more Raspberry Pi units.
The code is available from https://github.com/semanticarts/airquality
The experiment worked well. There were minor challenges in getting used to the Node RED framework, and I personally had the challenge of swapping between the dot notation of navigating JSON within Javascript and within the Node RED Mustache templating system. In all, it was a couple of Friday-afternoon experiment sessions, time well spent on an enjoyable starter project.
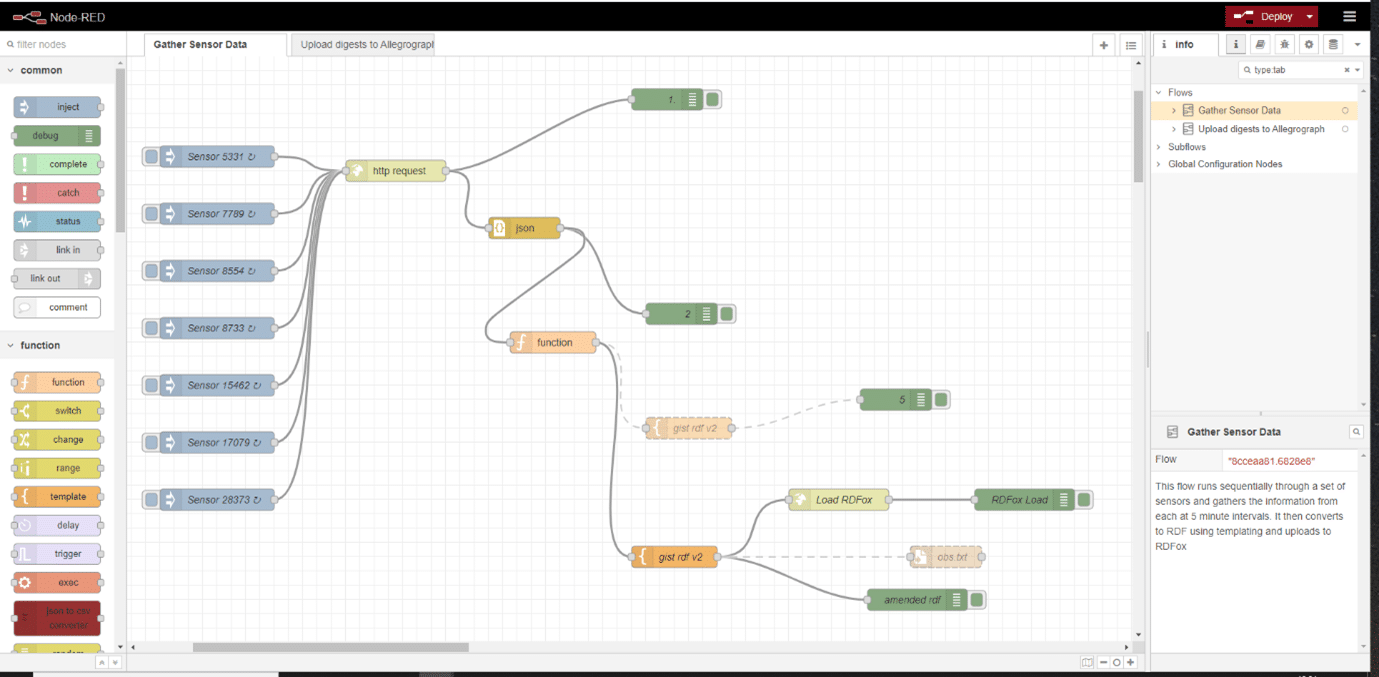
Fig 1: The ‘gather sensor data’ flow in Node-RED.
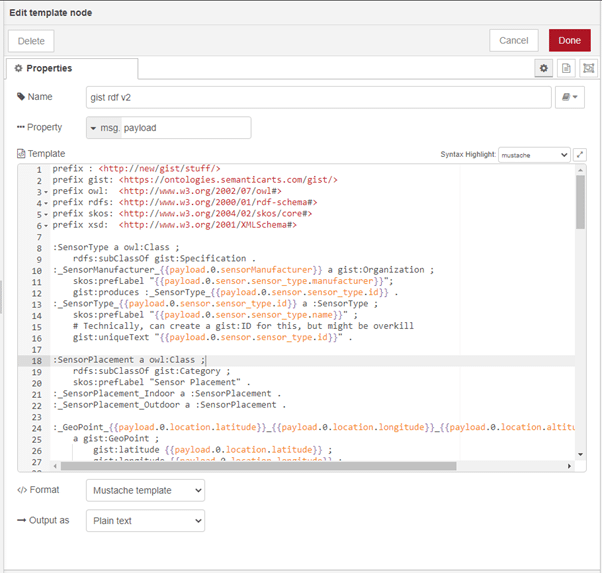
Fig 2: Merging the JSON data from the sensors into an RDF template using Mustache-style templating.
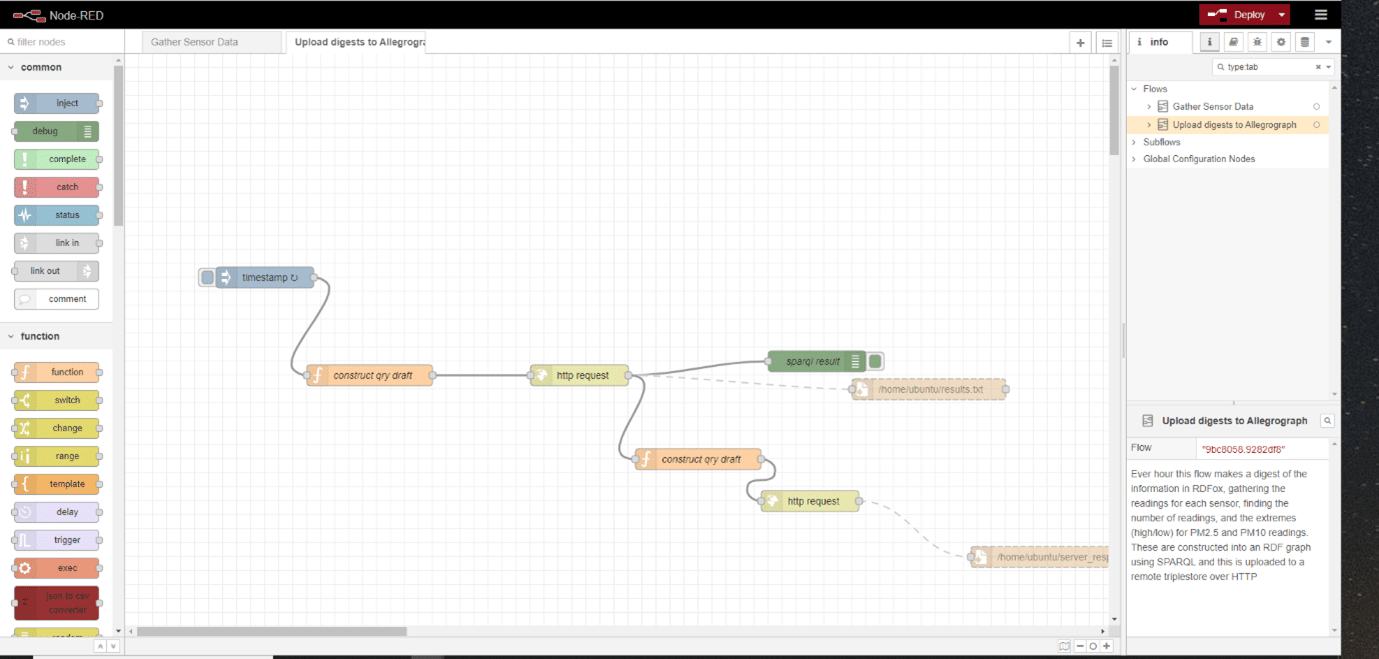
Fig 3: A simple flow to query RDFox on an hourly basis to get digests of the previous hour’s sensor data.
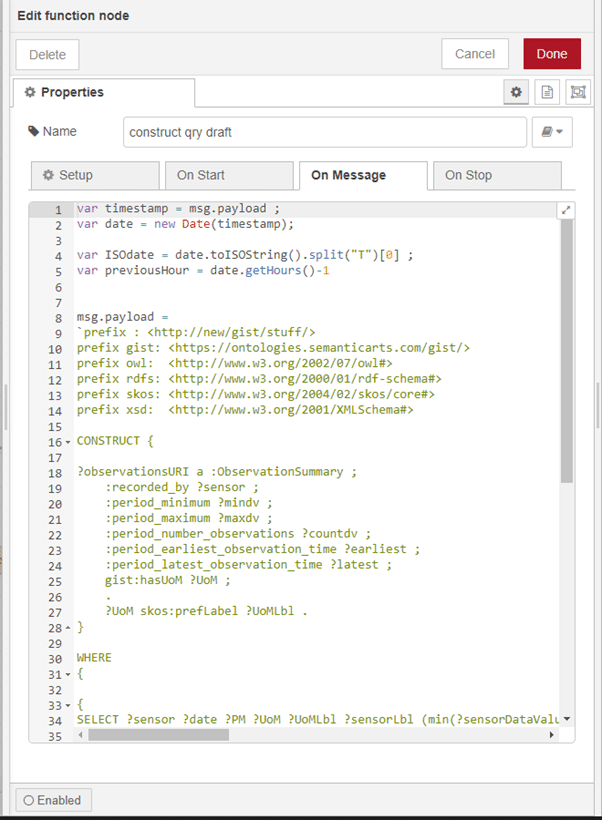
Fig 4: Part of the SPARQL ‘CONSTRUCT’ query that is used to create hourly digests of sensor data to send to the remote persisted RDFox instance.

Fig 5: Querying the RDFox store with SPARQL to see hourly maximum and minimum readings of air pollutants at each of the sensor sites.

Connect with the Author
I love this example of how useful and versatile the SemWeb stack is. And how gist provides a ready schema to extend!